Traffic Report: Western Canada Ports, June 2023
RailState, the rail industry’s only provider of real-time rail network visibility, independently tracks all freight rail movements across Canada in real-time, including traffic flows through the major western Canada ports. Data on freight flows across the Canada-US border is available here.
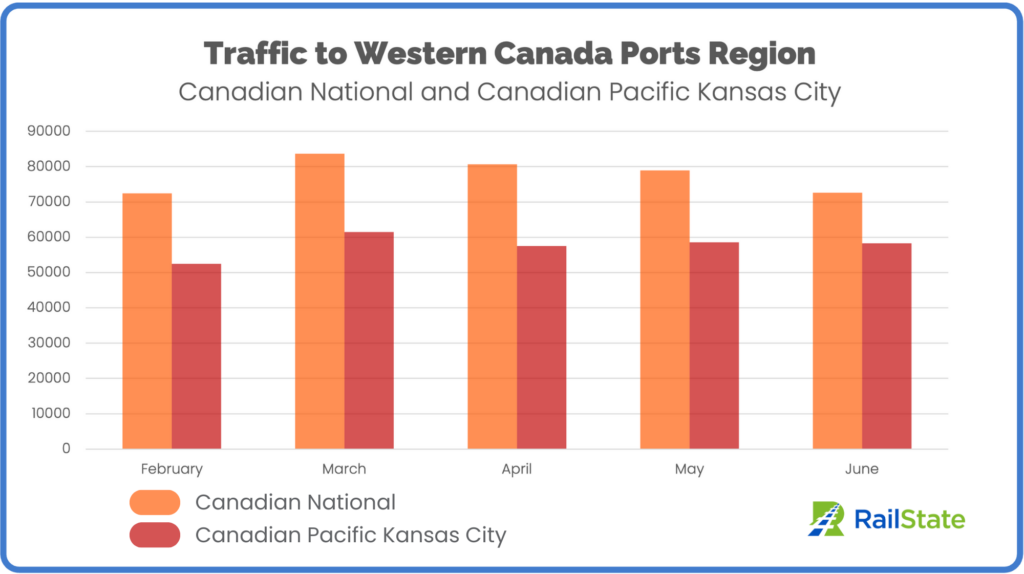
Overall traffic moving into the western ports region declined in June, going from 137,550 carloads moving to the ports in May to 130,906 carloads in June, a decrease of 4.8%. Daily average volume in June was 4,364 carloads per day. CN experienced a significant drop of 7.9% in carload volume in June, and CPKC stayed mostly flat, decreasing only 0.65% from May.
**Note** Westbound traffic into the ports region includes some traffic that ultimately moves southbound into the United States on BNSF, largely destined for the Seattle area. This is about 12.5% of traffic headed into the ports region. We include all freight cars moving into the ports region. The majority of carloads are headed to the ports for export but intermodal and vehicular cars headed westbound are typically empty. We have included these car types to monitor the overall traffic situation in the region and not to serve as a direct measurement of exports.
At the Ports – Flows into Port Region and Import Flows
Total traffic moving into the ports region outpaced import traffic for the first time since February. There were 130,906 carloads headed out to the western ports region and 130,276 carloads imported into the ports (630 carload difference). The previous three months showed 2000-5000 more carloads imported.
Most of the difference came from volume moved by CPKC. From March through May, CPKC carried more imported carloads, typically 4000-5000 more carloads coming in through the ports than heading out to the ports. In June, CPKC carried 116 more carloads out to the ports region.
CN has consistently carried more carloads out to the ports region than what has come in through imports and that trend continued in June, with 514 more carloads moving westbound to the ports region.
What is Moving – Car Mix
CPKC
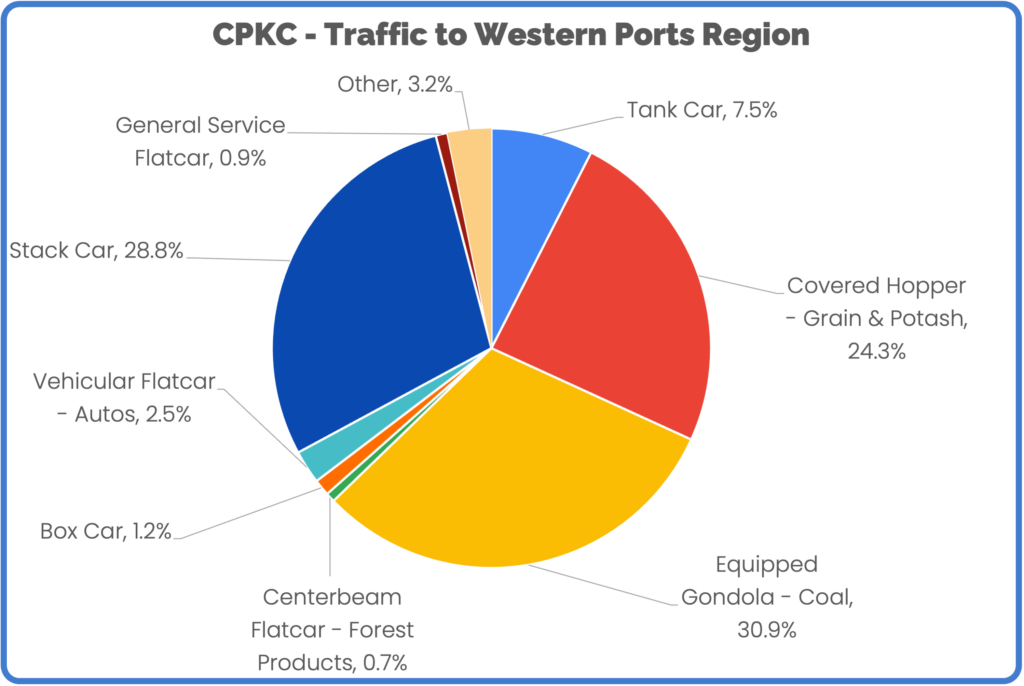
CPKC started June carrying more stack cars and general service flat cars, which accounted for 33.5% of carloads in the first half of the month. In the later part of June, CPKC decreased the proportion of stack cars and general service flat cars and increased the volume of covered hoppers. The cars that could carry containers went from 33.5% of traffic in the first half of June down to 29.7% to end the month. Covered hopper volume grew from 21.5% in early June to 24.3% at the end of the month.
Compared to May, this is still an overall shift in favor of stacks cars and general service flats (29.7% compared to 24.3% in May) and away from covered hoppers (24.3% compared to 28.4% in May).
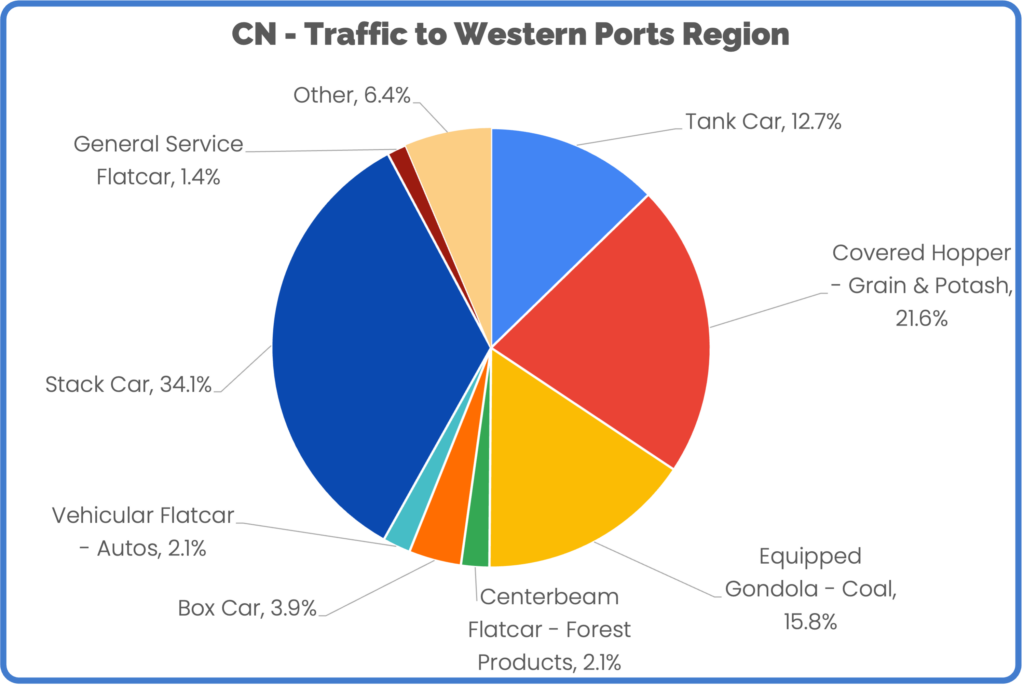
CN
CN showed fewer changes in carload mix from the beginning of the month and from the previous month. Most changes were negligible and less than one percentage point for any carload type.