Traffic Report: Western Ports, May 2023
RailState, the rail industry’s only provider of real-time rail network visibility, independently tracks all freight rail movements across Canada in real-time, including traffic flows through the major western Canada ports. Data on freight flows across the Canada-US border is available here.
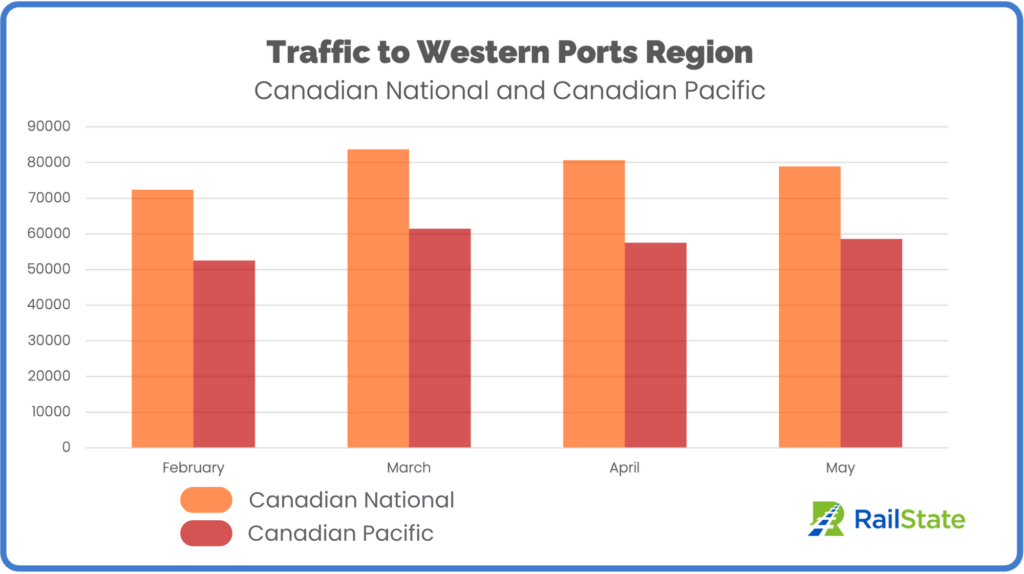
Overall traffic moving into the western ports region stayed flat in May, going from 138,194 carloads moving to the ports in April to 137,550 carloads in May, a marginal decrease of 0.47%. Daily average volume in May was 4,585 carloads per day. CN experienced a modest decline of 2.2% in carload volume in May, and CP showed a slight increase of 1.9%.
**Note** Westbound traffic into the ports region includes some traffic that ultimately moves southbound into the United States on BNSF, largely destined for the Seattle area. This is about 12.5% of traffic headed into the ports region. We include all freight cars moving into the ports region. The majority of carloads are headed to the ports for export but intermodal and vehicular cars headed westbound are typically empty. We have included these car types to monitor the overall traffic situation in the region and not to serve as a direct measurement of exports.
At the Ports – Flows into Port Region and Import Flows
Import traffic into the ports of Vancouver and Ridley eclipsed traffic moving westbound into the ports region in May, with 141,304 carloads coming into Canada compared to 137,550 moving toward the ports, a 3,754 carload difference.
Over the past three months CP showed significantly greater import flows, with 5,650 more carloads imported in May, 4,658 more carloads imported in April, and 4,138 more carloads imported in March. CN carried 1,896 more carloads into the ports region for export in May.
What is Moving – Car Mix
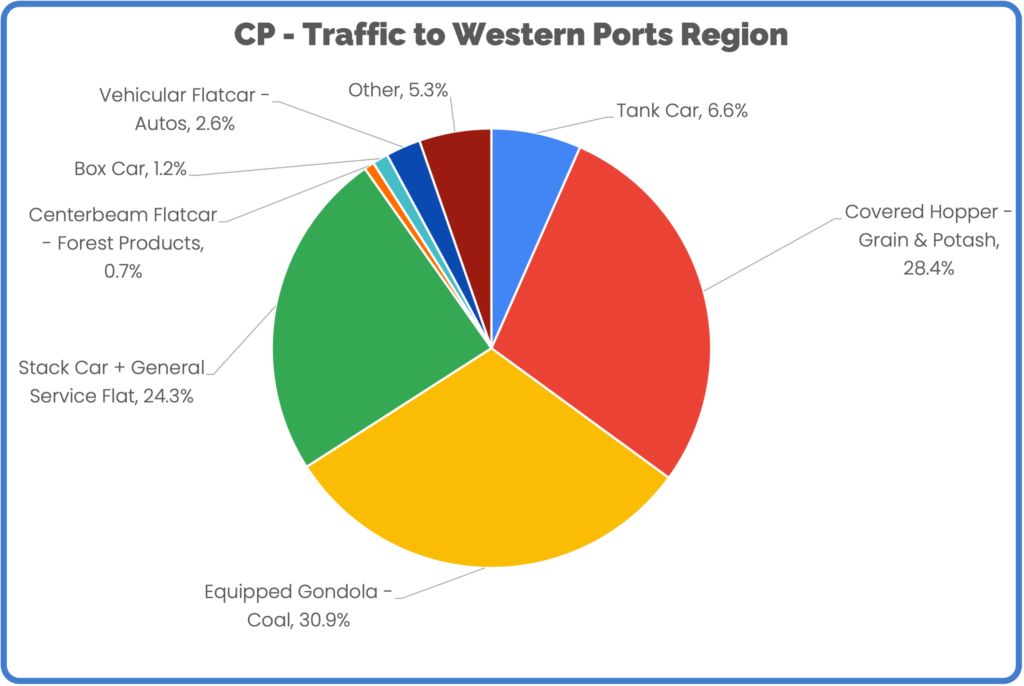
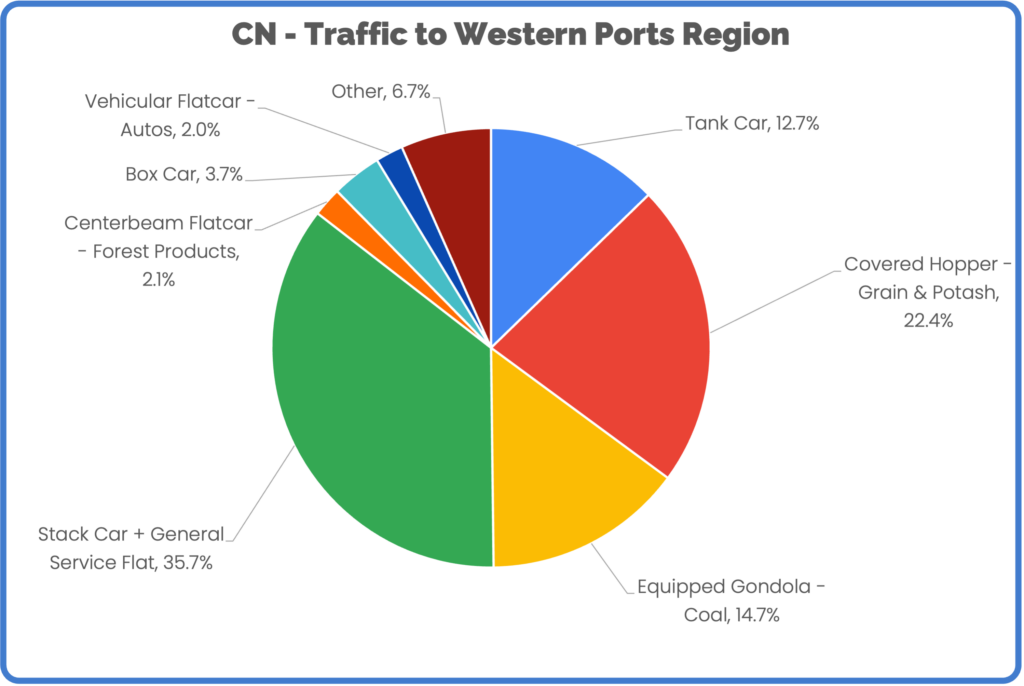
CP carries a narrower mix of carloads into the ports region. Tank cars, covered hoppers, and gondolas account for 66% of CP traffic, demonstrating a bigger focus on energy and agricultural products for export.
CN’s use of tank cars is nearly double CP’s in terms of proportion of traffic and given CN’s greater overall volume, this accounts for 2.5 times the number of tank cars moving to ports on CN compared to CP. Although CP has a much larger percentage of traffic dedicated to equipped gondolas, the car count difference is much smaller, with CP moving 18,100 gondolas to the ports region and CN moving 11,600.