MARKET INTELLIGENCE
Stay Ahead with Rail Network Intelligence
Monitor commodity flows as they happen, discover new opportunities, and benchmark performance across the rail network.
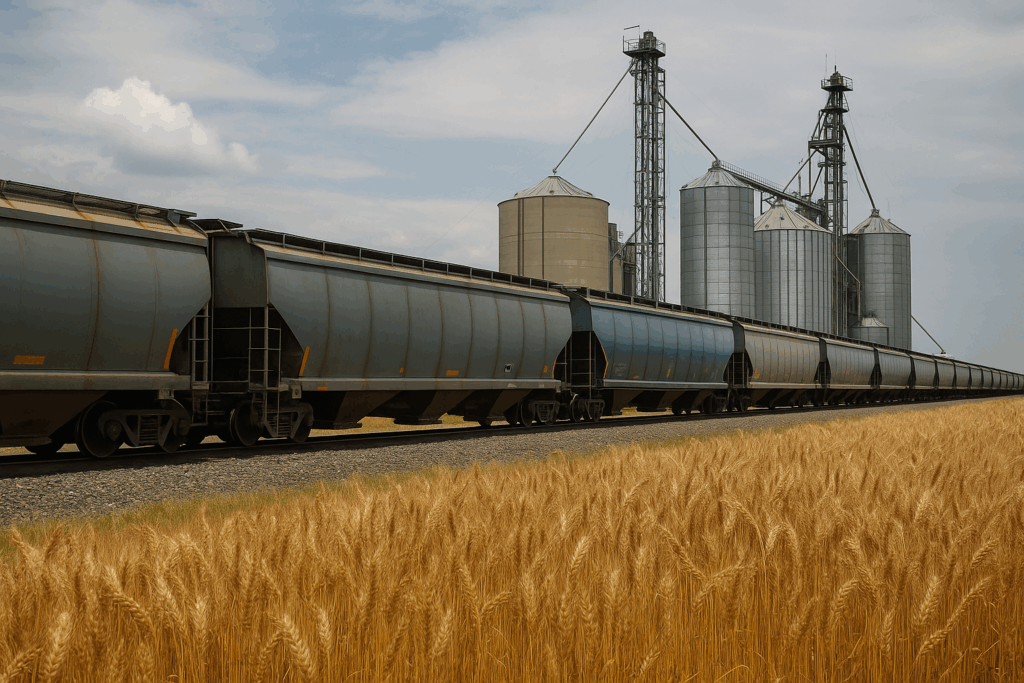
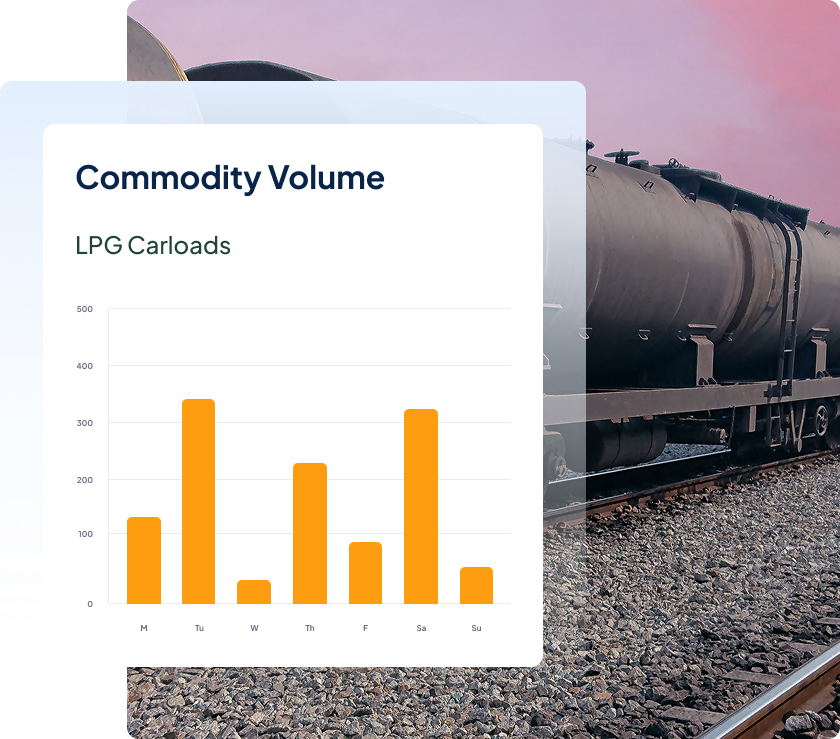
Track Commodity Shifts As They Happen
Commodity data is often aggregated and available weeks or more after action took place – too late to make decisions that give you an edge.
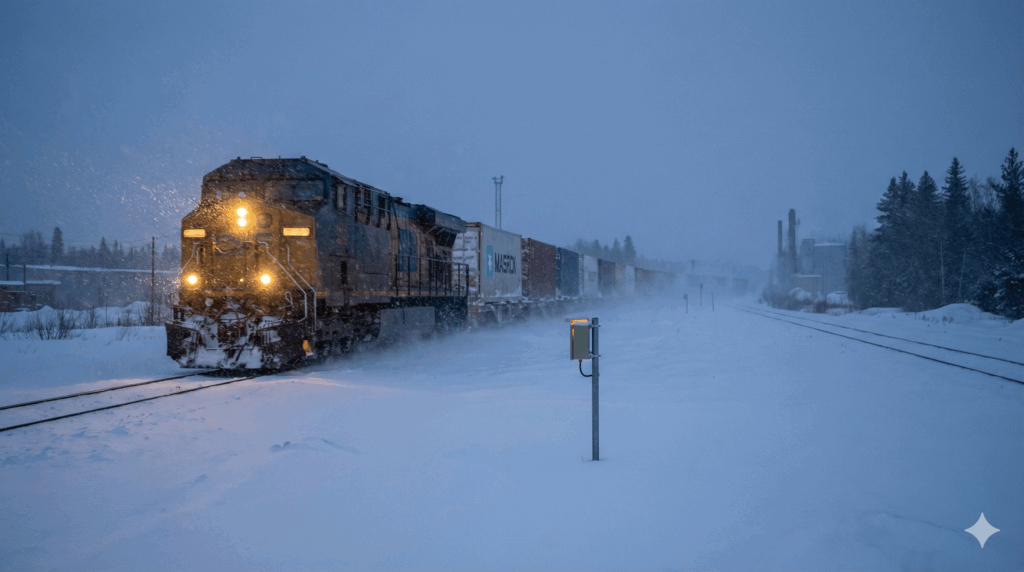
RailState provides real-time visibility into commodity shipments across the network, showing what’s moving where and flagging when flows shift so you can act fast.
- Data in less than 25 minutes for immediate insight into commodity flows
- Filter by commodity, route, or region to measure movements relevant to your business
- Customized alerts for commodity flow surges or slowdowns on critical routes
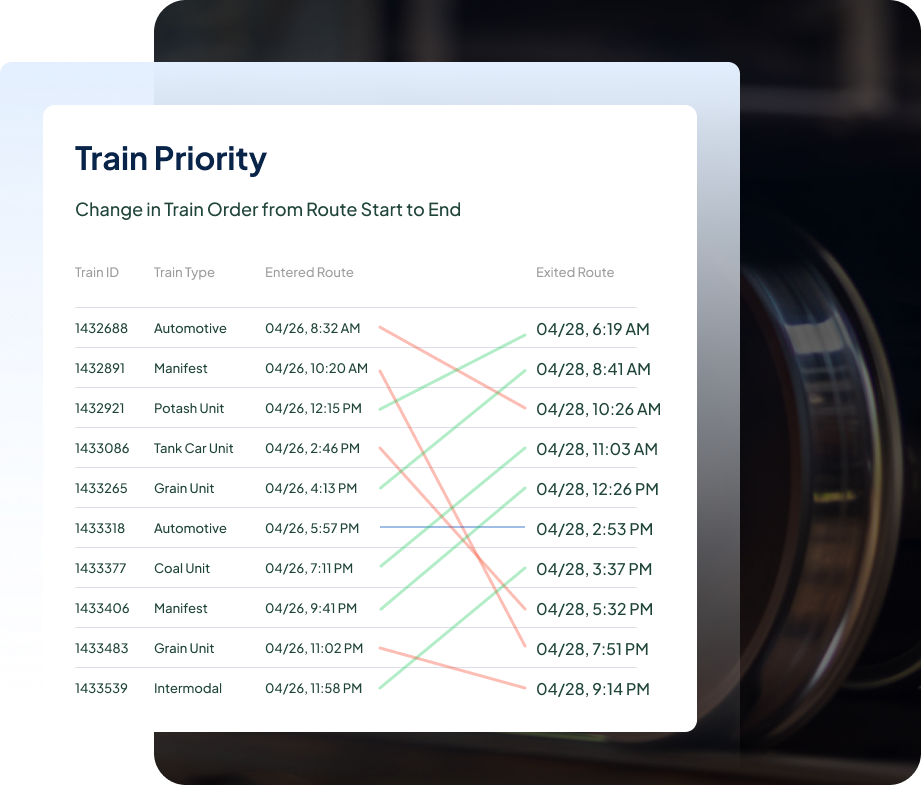
Explore New Markets for Growth
With data only for your existing routes, new markets and routes remain opaque, forcing you to rely on costly external studies or work with guesswork.
RailState’s network-wide insights lets you spot hidden routes and emerging markets, revealing new opportunities without costly research or guesswork.
- Commodity flows by corridor to spot emerging demand trends
- Route-specific transit times and peak seasonal demand to evaluate service viability in new lanes.
- Traffic volumes and flow patterns by region to identify untapped markets or underserved routes
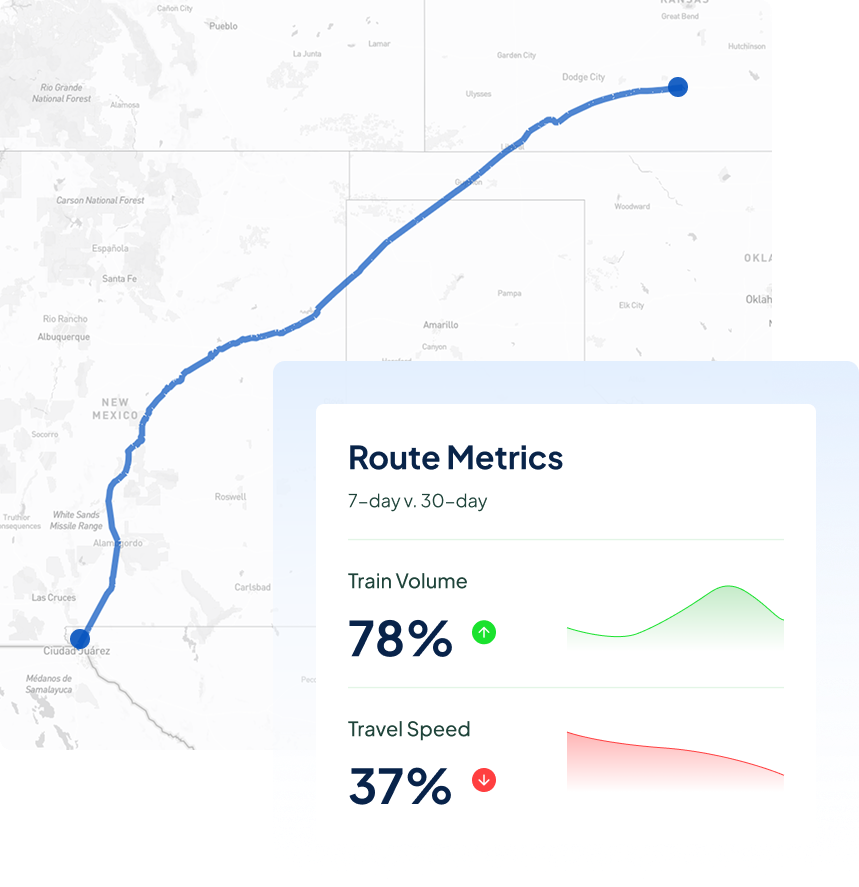
Compare Performance to Your Competition
Without independent rail data, objective benchmarking against competitors or industry standards is nearly impossible, leaving you unsure where you stand.
Objective, network-wide performance metrics let you benchmark against the market to understand how you really stack up.
- Your share of rail service versus competitors: see if you’re getting your fair share
- Service priority by industry to see who performs best
- Route-by-route metrics to identify where you stand in any market
Explore Other Use Cases
Our Coverage Area
We have completed coverage across Canada, the US-Canada border, the US-Mexico border, and we are quickly expanding across the United States.
- Blue: Up to 4 years of data history
- Green: Coming online within the next 90 days
Latest Insights
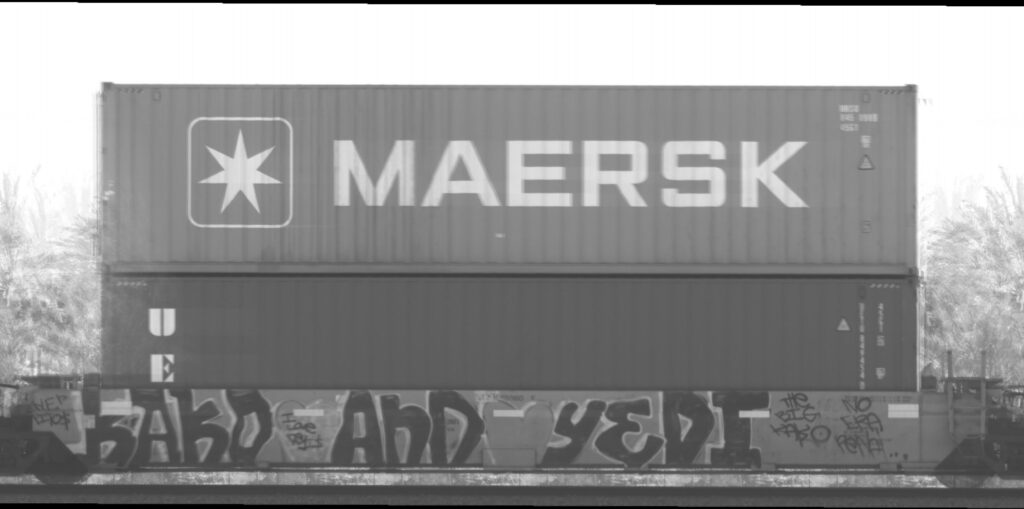
Maersk Moves to UP
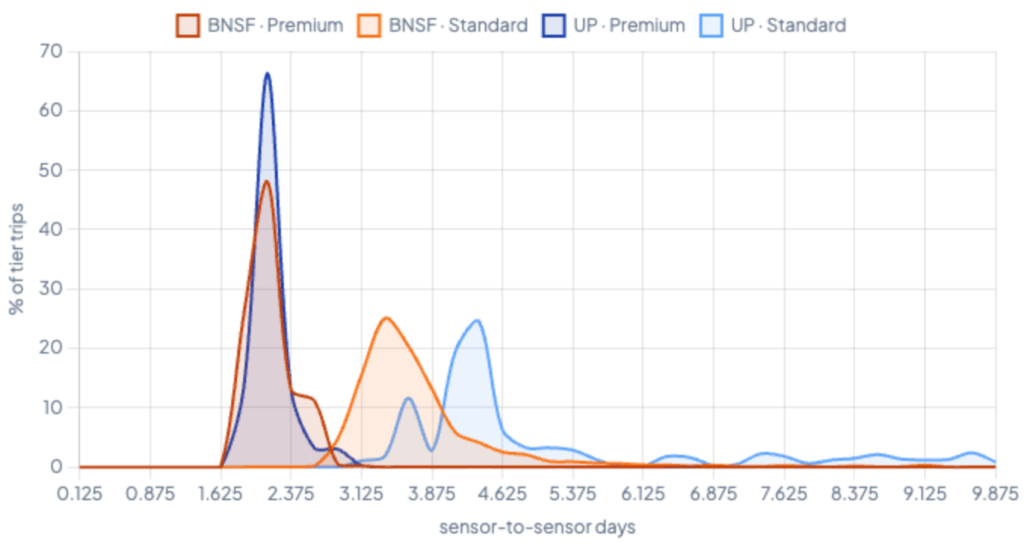
A Tale of Two Corridors
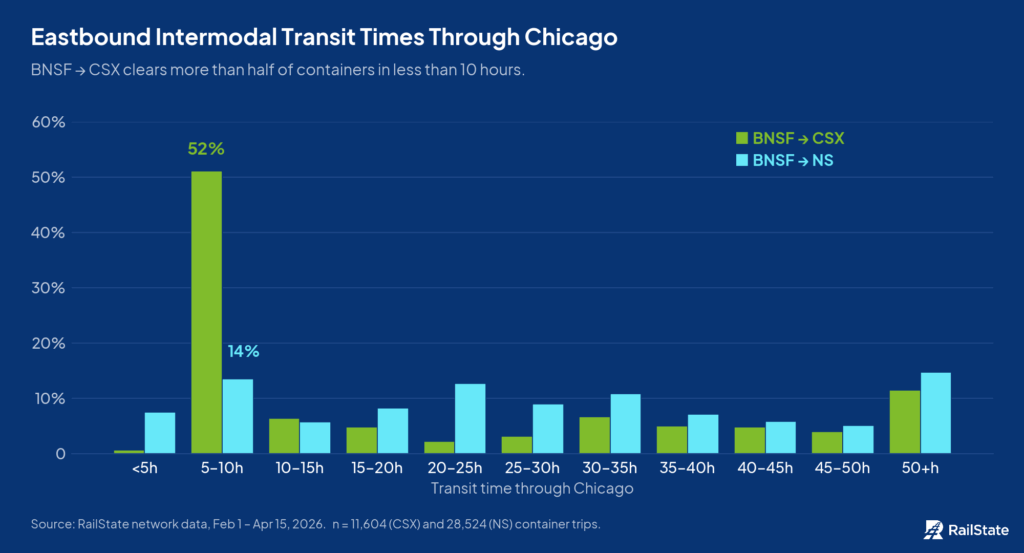
How Bad is the Rail Bottleneck in Chicago?
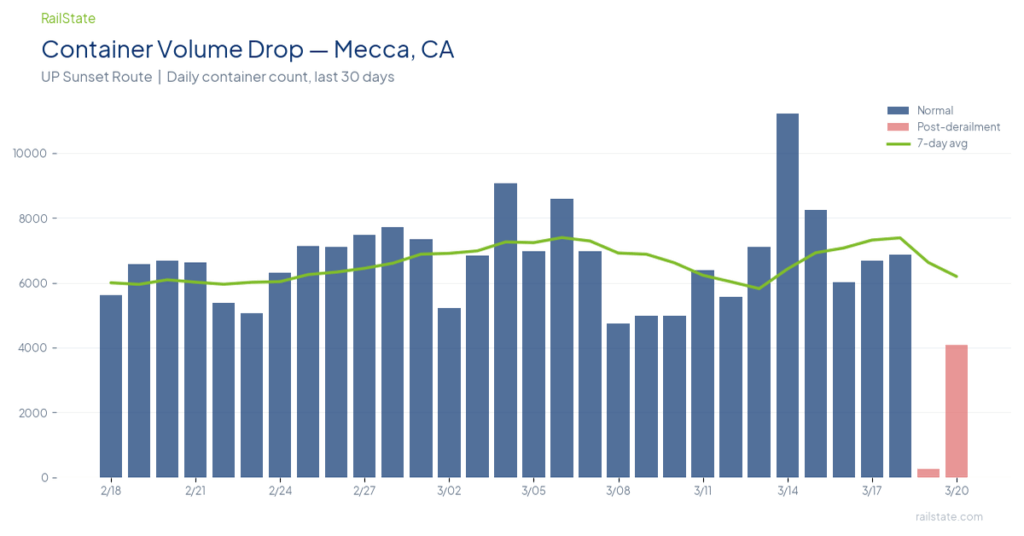
Two Derailments in 36 Hours Choke Major U.S. Freight Corridors
Winter Storm Fern: RailState Data Shows Network Impact Across Three States