Traffic Report: Western Ports, April 2023
RailState, the rail industry’s only provider of real-time rail network visibility, independently tracks all freight rail movements across Canada in real-time, including traffic flows through the major western Canada ports. Data on freight flows across the Canada-US border is available here.
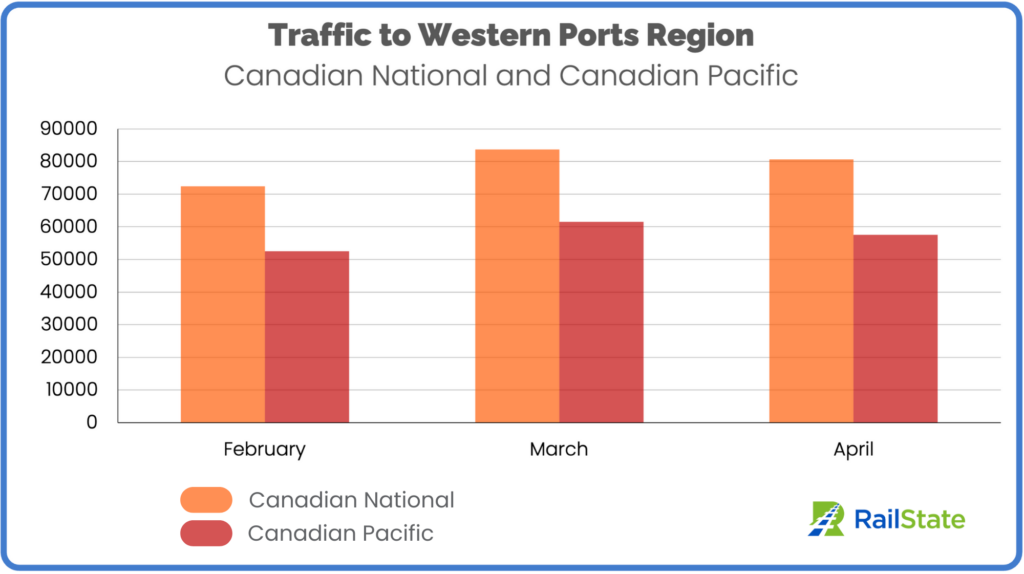
Overall traffic moving into the western ports region decreased in April by 4.8%, going from 145,159 carloads moving to the ports in March to 138,194 carloads in April. March traffic to the western ports region was 16.2% higher than February. Much of that growth is explained by the extra days in the month, but there was also a 5.0% increase in daily average car volume, growing from 4,461 cars per day to 4,683. Daily average volume in April was down slightly to 4,606 carloads per day (-1.6% change from March).
Both CN and CP lines saw significant growth in overall traffic to the western ports region in March and declines in April. CN traffic grew 15.6% in March and fell 3.6% in April. CP traffic grew 17.0% in March and was down 6.4% in April.
**Note** Westbound traffic into the ports region includes some traffic that ultimately moves southbound into the United States on BNSF, largely destined for the Seattle area. This is about 12.5% of traffic headed into the ports region. We include all freight cars moving into the ports region. The majority of carloads are headed to the ports for export but intermodal and vehicular cars headed westbound are typically empty. We have included these car types to monitor the overall traffic situation in the region and not to serve as a direct measurement of exports.
At the Ports – Flows into Port Region and Import Flows
Import traffic into the ports of Vancouver and Ridley eclipsed traffic moving westbound into the ports region in April, with 143,173 carloads coming into Canada compared to 138,194 moving toward the ports, a 4,974 car difference.
In March, import traffic was closer to westbound traffic to the ports region, with only a 2,102-carload difference in favor of imports. Flows in February were even, with a difference of 347 more carloads headed western into the ports region.
In the last two months CP showed significantly greater import flows, with 4,658 more carloads imported in April and 4,138 more carloads imported in March. CN had a different trend, with 321 more imported carloads in April and 2,036 more carloads headed westbound into the ports region in March.
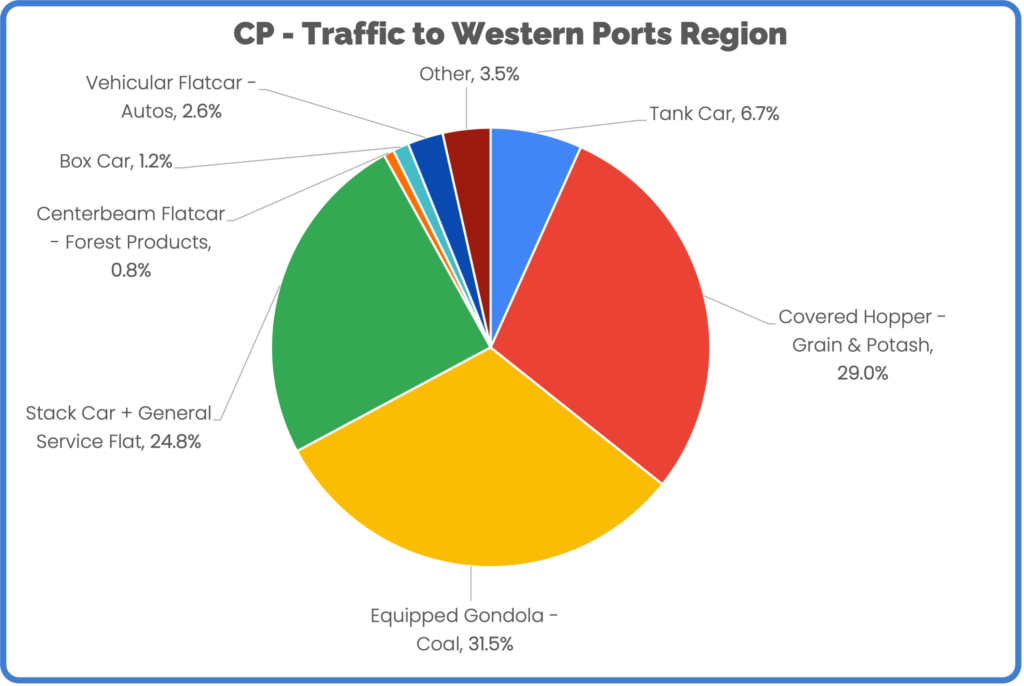
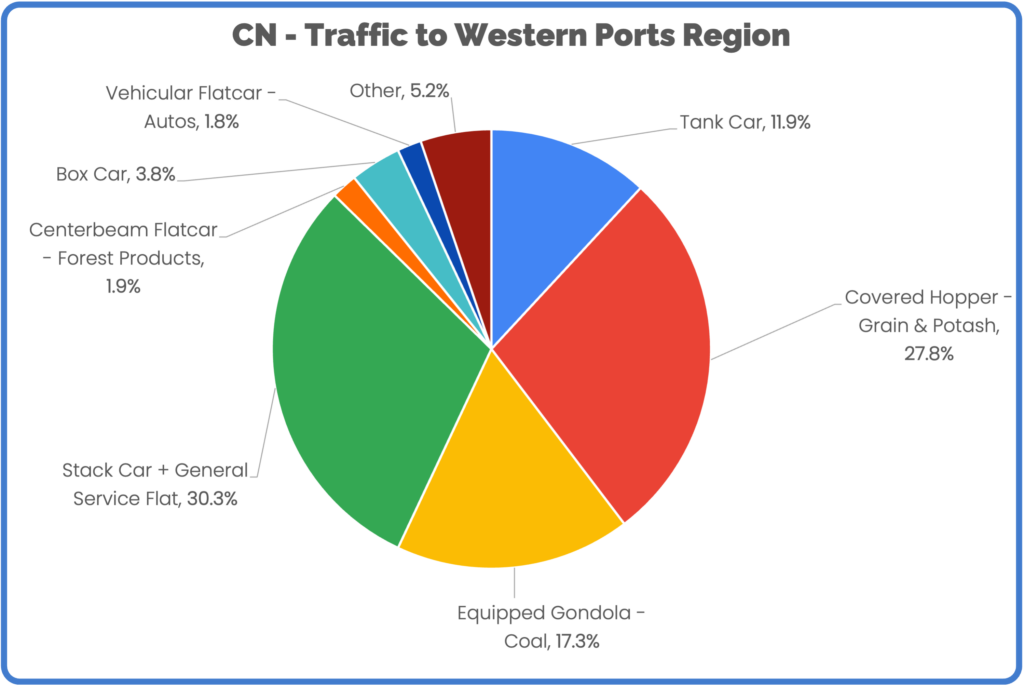
What is Moving – Car Mix
CP carries a narrower mix of carloads into the ports region. Tank cars, covered hoppers, and gondolas account for 67% of CP traffic, demonstrating a bigger focus on energy and agricultural products for export.
CN’s use of tank cars is nearly double CP’s in terms of proportion of traffic and given CN’s greater overall volume, this accounts for 2.5 times the number of tank cars moving to ports on CN compared to CP. Although CP has a much larger percentage of traffic dedicated to equipped gondolas, the car count difference is much smaller, with CP moving 18,000 gondolas to the ports region and CN moving 14,000.