Traffic Report: Cross Border, April 2023
RailState, the rail industry’s only provider of real-time rail network visibility, independently tracks all freight rail movements across Canada in real-time, including traffic flows through US/Canada border crossings. Data on traffic flows to the western ports region for export is available here.
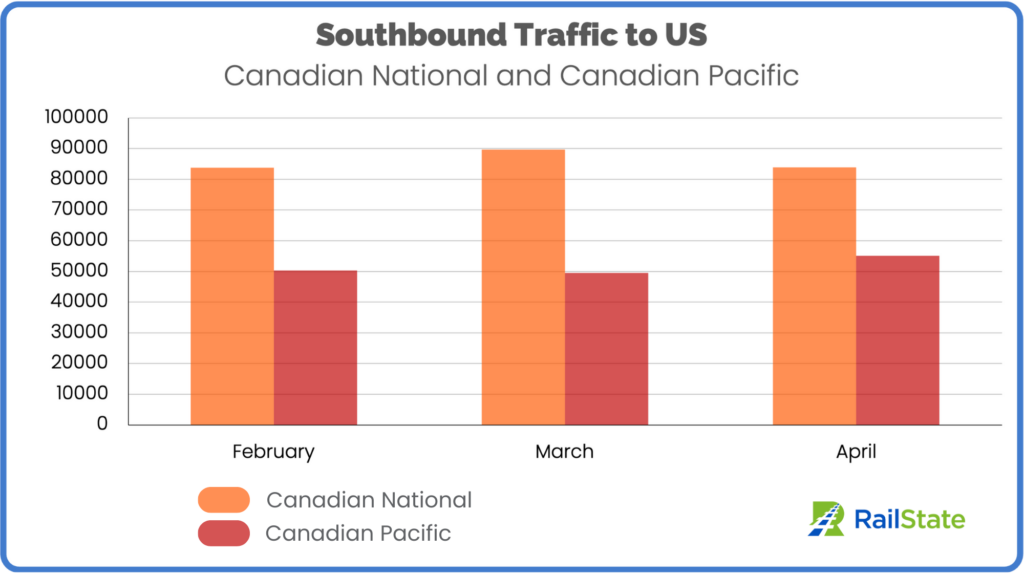
Total southbound traffic from Canada was 134,124 cars in February, 139,283 in March, and 138,996 in April. CN commands the majority of that traffic, 62.4% of total southbound traffic over the past three months. This is higher than the proportion of total export traffic to western ports, for which CN moves 58% of total traffic.
Total southbound traffic on CN in April was 83,897 cars, which was about the same as the traffic volume in February (83,834 cars) and 6.5% lower than traffic in March (89,716 cars). That has resulted in a consistent and moderate decline in daily average traffic over the same period. CN carried 3000 cars per day in February, 2900 cars per day in March, and about 2800 cars per day in April.
CP showed a significant increase in total southbound traffic from March to April, growing 11.2% from 49,567 cars in March to 55,099 cars in April. Average daily southbound traffic for CP has fluctuated over the last three months, with 1800 cars per day in February, dropping to 1600 per day in March, and rebounding to just over 1800 per day in April.
At the Border – Southbound and Northbound Flows
Northbound traffic into Canada outpaced southbound traffic in April, with 144,566 cars coming into Canada compared to 138,996 going to the US.
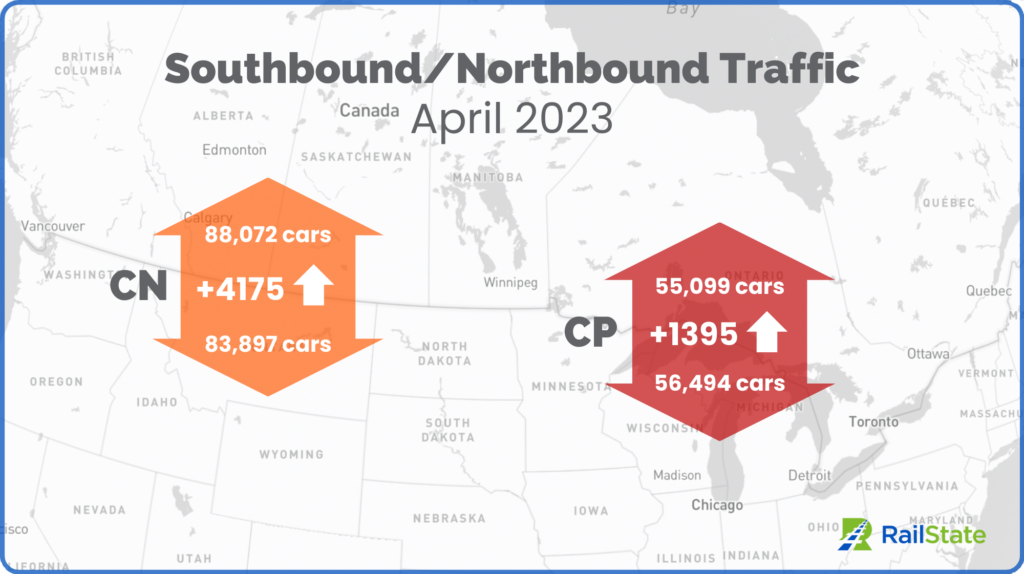
In March, southbound traffic was 2,270 cars greater than northbound. February traffic was greater for southbound flows, by 4,240 cars.
Most of the differences in April and March came on CN, which saw 4,175 more cars coming northbound, accounting for 75% of the total difference in northbound v. southbound traffic. In March, CN carried 2,376 more cars southbound.
In February, CP carried 3,762 more cars southbound, compared to CN only carrying 478 more southbound cars than northbound cars.
The busiest border crossings on CN-originated traffic were Fort Frances, ON/International Falls, MN (40.5% of total CN southbound traffic), Port Huron, MI (37.1%), and Blaine, WA/Vancouver-Seattle (via BNSF) (19.9%). At Fort Frances, CN carried 8.22% more cars northbound over the past three months. At Port Huron, there were 7.62% more southbound cars over the same period.
For CP, the busiest crossings were Windsor (29.3% of total CP southbound traffic), North Portal, SK (24.3%), Kingsgate, BC (20.3%), and Emerson, MB (19.4%). Only Emerson saw notable differences in northbound v. southbound traffic, with 8.1% higher southbound traffic over the past three months.
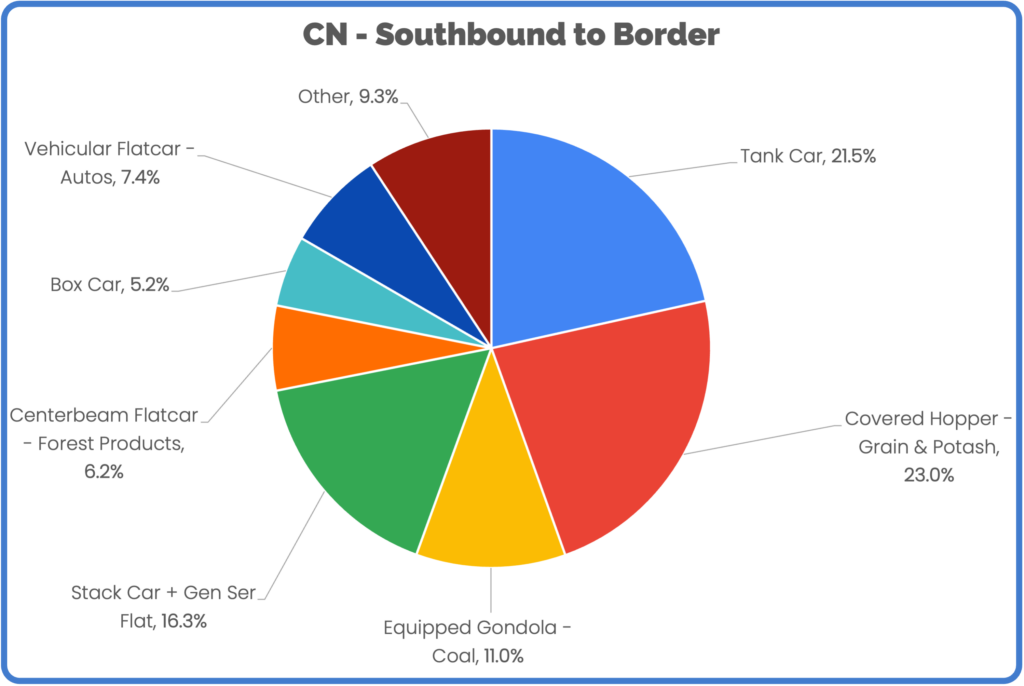
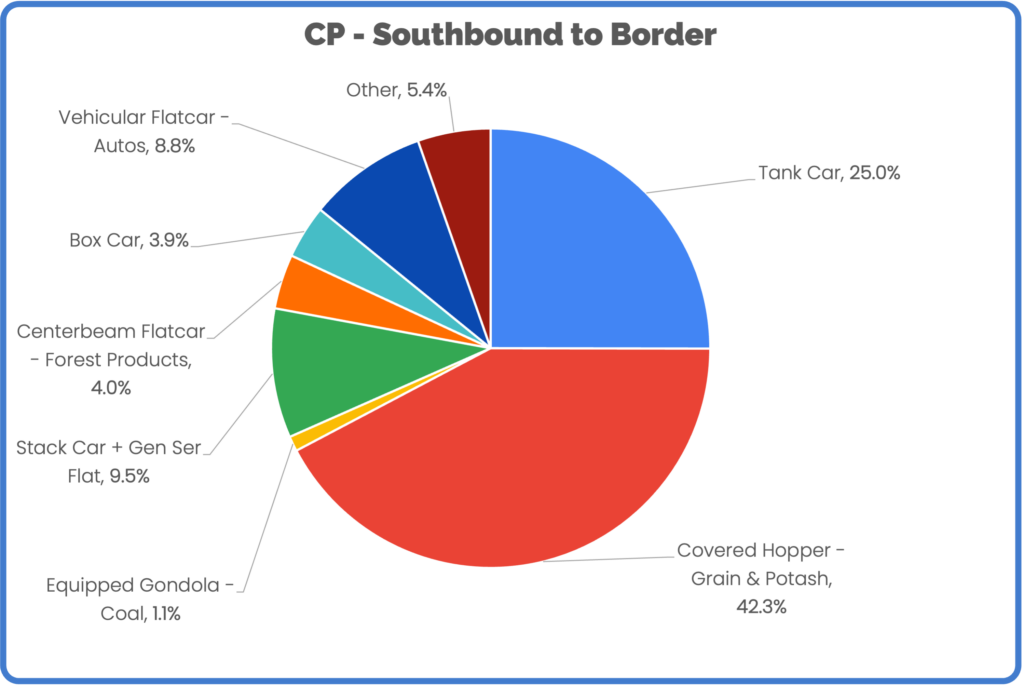
What is Moving – Car Mix
The two rail lines carry substantially different mixes of cars although both carry energy products and agricultural commodities as their biggest categories.
CP leans more heavily on energy and agricultural products southbound to the US than CN. A quarter of cars over the past three months were tank cars and 42.3% of cars were covered hoppers (grain and potash).
CN carries a similar proportion of tank cars (21.5%), far fewer covered hoppers, and a greater proportion of stack cars (16.3%) and equipped gondolas (11.0%).