Traffic Report: Western Canada Ports, Mid-June 2023

RailState, the rail industry’s only provider of real-time rail network visibility, independently tracks all freight rail movements across Canada in real-time, including traffic flows through the major western Canada ports. Data on freight flows across the Canada-US border is available here.
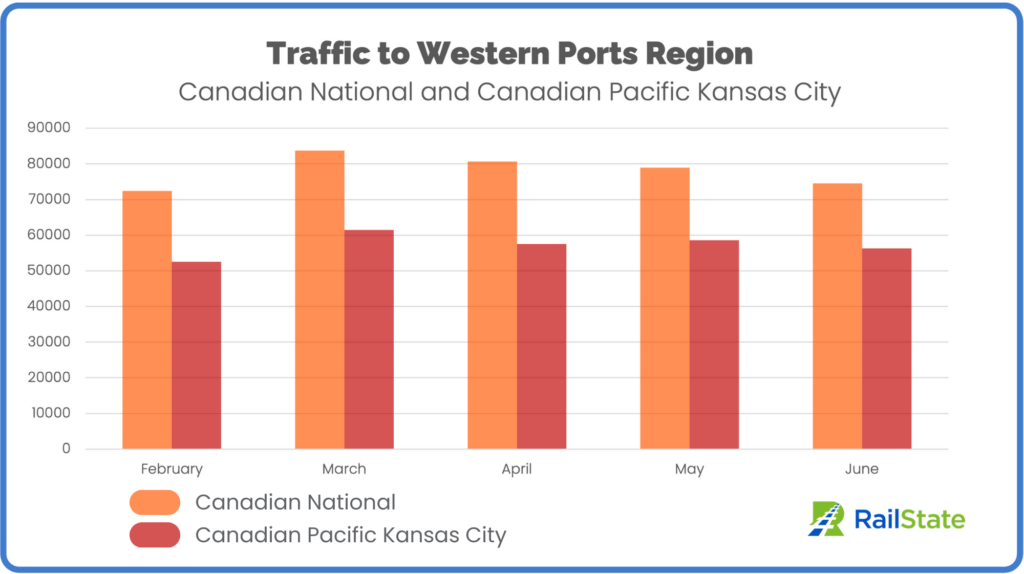
Overall traffic moving into the western ports region is down 4.9% in the first two weeks of June. Total volume to the western ports region is on pace to hit 130,800 carloads by the end of the month, about 7,000 fewer carloads than in May. Daily average volume in June is 4,360 carloads per day, about 200 fewer carloads per day than the previous month.
Traffic to the ports region is down across both carriers. CPKC daily volume decreased 4% from May and CN’s daily average volume to the ports region decreased 5.6%.
**Note** Westbound traffic into the ports region includes some traffic that ultimately moves southbound into the United States on BNSF, largely destined for the Seattle area. This is about 12.5% of traffic headed into the ports region. We include all freight cars moving into the ports region. The majority of carloads are headed to the ports for export but intermodal and vehicular cars headed westbound are typically empty. We have included these car types to monitor the overall traffic situation in the region and not to serve as a direct measurement of exports.
At the Ports – Flows into Port Region and Import Flows
Traffic trends based on June 1-15 data show traffic moving into the ports region outpacing import traffic for the first time since February. This means 130,796 carloads heading out to the western ports region and 128,696 carloads imported into the ports if trends continue through the end of the month.
From March through May, CPKC carried more imported carloads, typically 4000-5000 more carloads coming in through the ports than heading out to the ports. In early June, volume on CPKC has been even in both directions, reflecting a moderate increase in traffic out to the ports relative to import traffic coming into Canada.
CN has consistently carried more carloads out to the ports region than what has come in through imports and that trend continued in early June.
What is Moving – Car Mix
CPKC
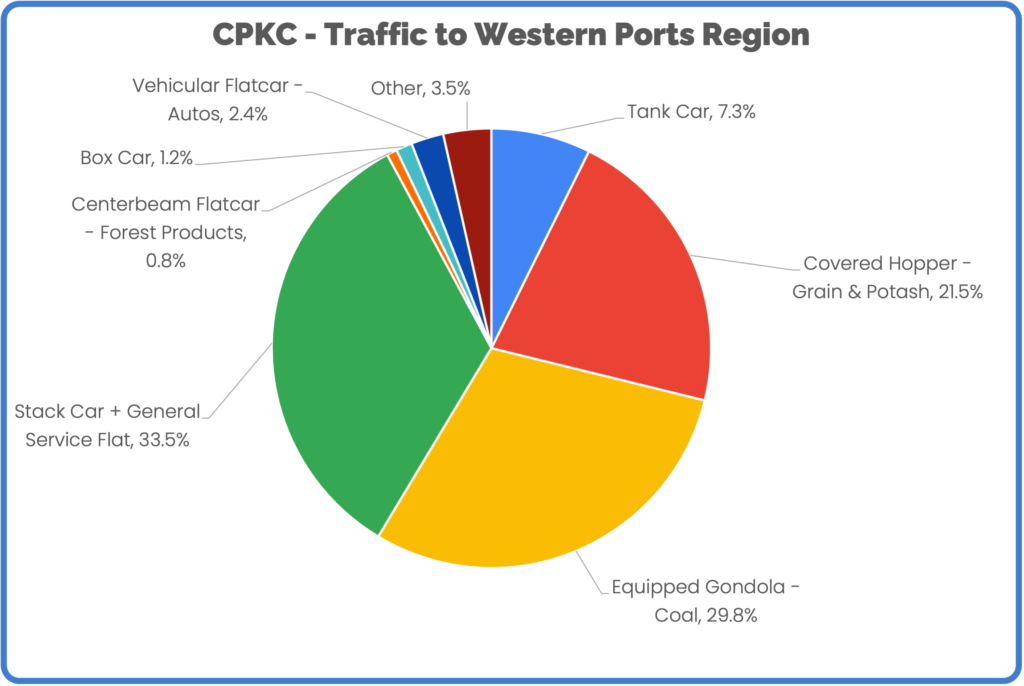
CPKC shows a notable change in carload mix in June compared to May, carrying significantly more stack cars and general service flats and fewer covered hoppers. Stack cars and general service flats accounted for 33.5% of CPKC traffic to the western ports region in June, up from 24.3% in May. Covered hoppers dropped from 28.5% of carloads in May to 21.5% in June. The other car types are all in line with their proportions in May.

CN
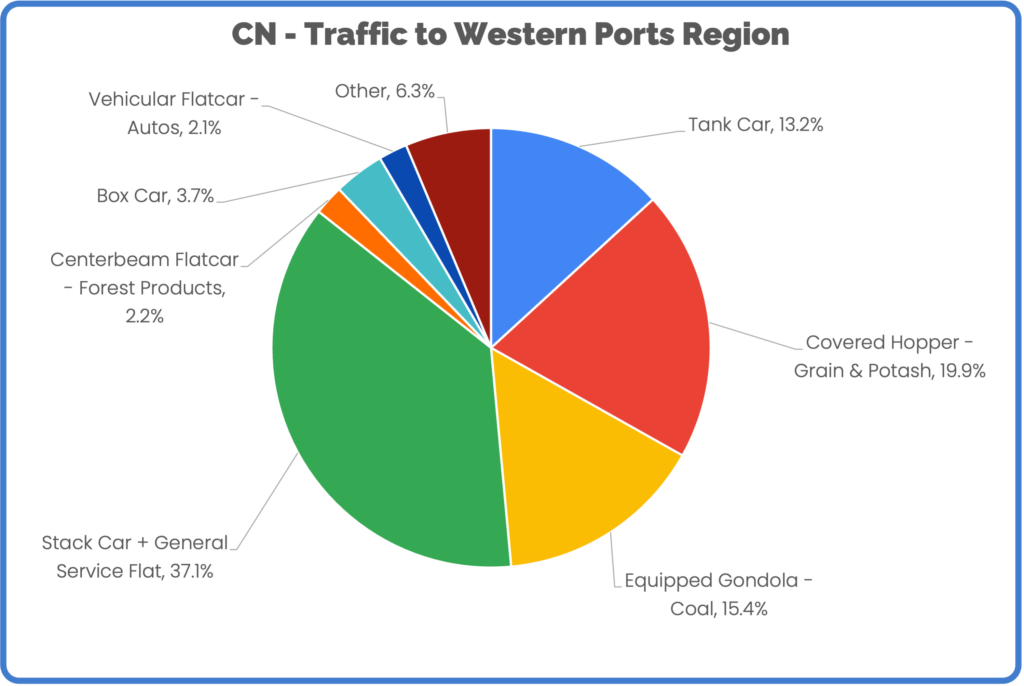
CN shows less variation in June compared to the previous month. Like CPKC, CN also increased the percentage of stack cars and general service flats, going to 37.1% in June, compared to 35.7% in May. Covered hoppers dropped to 19.9% of traffic in June from 22.4% in May. All other car types are in line with their proportions from last month.

