Traffic Report: Cross Border, Mid-June 2023

RailState, the rail industry’s only provider of real-time rail network visibility, independently tracks all freight rail movements across Canada in real-time, including traffic flows through US/Canada border crossings. Data on traffic flows to the western ports region for export is available here.
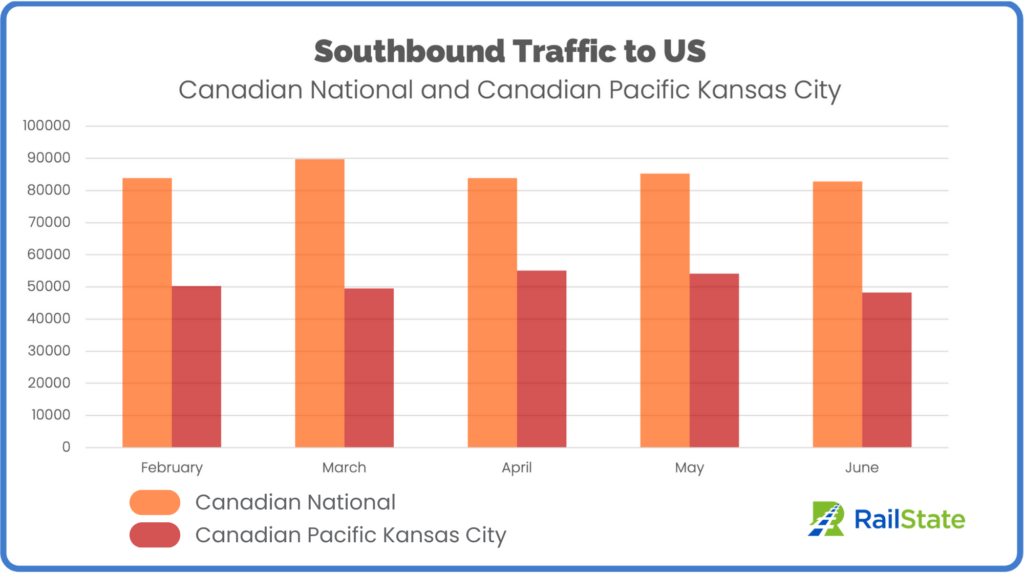
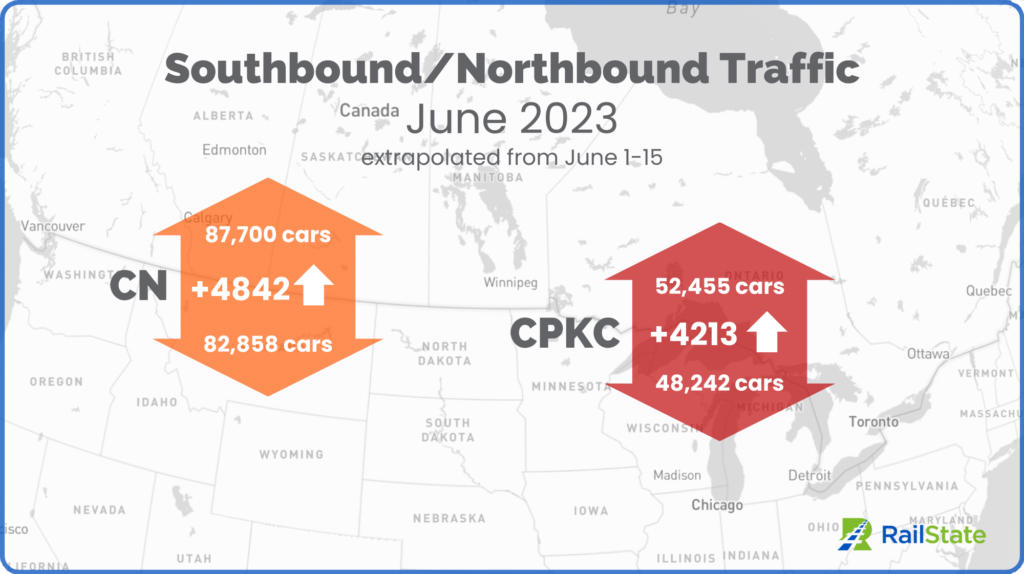
Southbound traffic into the US declined in June on both carriers. CPKC saw a larger drop of 10.9% in southbound traffic compared to May, and CN saw a modest decrease of 2.8%. Based on data from June 1-15, this month is on pace to have the lowest total southbound traffic in the previous five months. Traffic moving northbound into Canada in June, however, is in line with trends so far this year.
At the Border – Southbound and Northbound Flows
Northbound traffic into Canada is on pace to top southbound traffic by about 9,000 carloads in June.

The busiest border crossings on CN-originated traffic were Port Huron, MI (40.0% of total CN southbound traffic), Fort Frances, ON/International Falls, MN (34.4%), and Blaine, WA/Vancouver-Seattle (via BNSF) (23.0%). At Fort Frances, CN carried 32% more cars northbound in June. At Port Huron, CN moved 13% more southbound cars than northbound.
For CPKC, the busiest crossings were Windsor (33.1% of total CPKC southbound traffic), North Portal, SK (27.2%), Emerson, MB (18.0%), and Kingsgate, BC (13.3%). Northbound traffic outpaced southbound traffic most significantly at North Portal, carrying 30% more northbound traffic in June.
What is Moving – Car Mix
CPKC
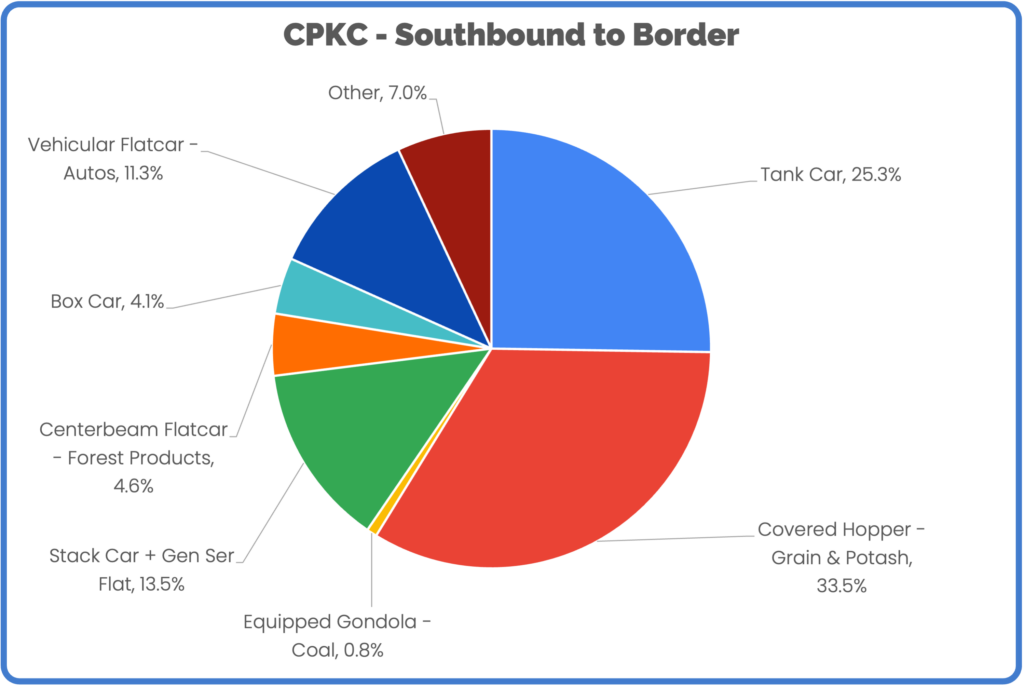
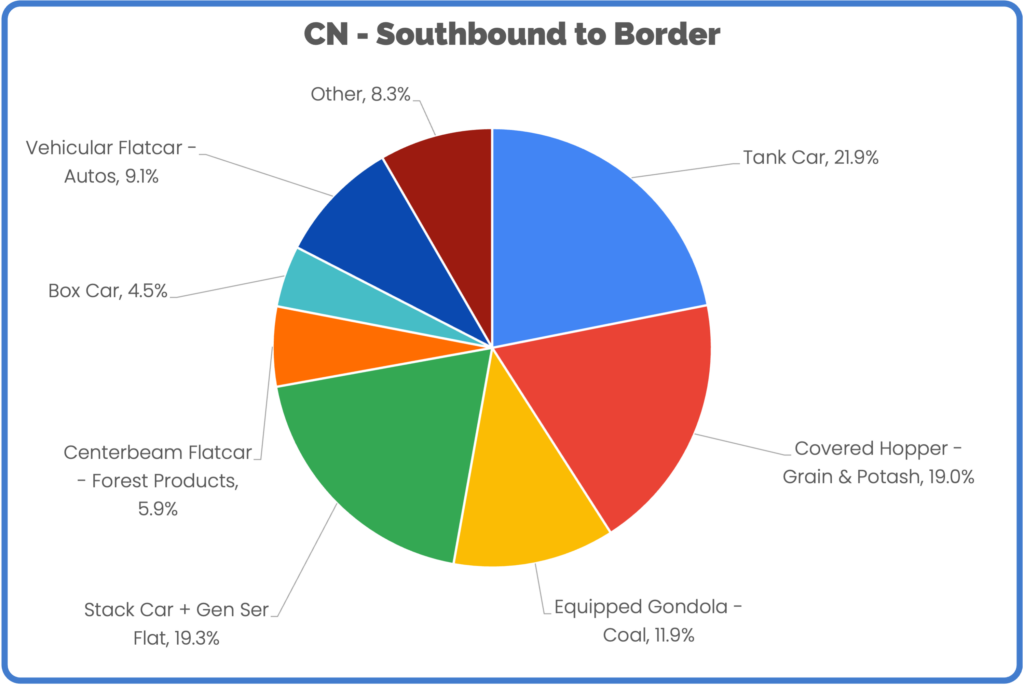
CPKC carries a greater proportion of energy and agricultural products across the border. In May, tank cars and covered hoppers accounted for 63.3% of total CPKC cross border traffic. In June, these car types account for 58.8% of traffic. Tank cars slightly increased from 24.1% to 25.3% while covered hoppers decreased from 39.2% to 33.5%.
Making up for the drop in covered hoppers was an increase in stack cars and general service flats increasing from 11.1% to 13.5% and vehicular flatcars jumping to 11.3% from 9.7% in May.


