Traffic Report: Cross Border, June 2023
RailState, the rail industry’s only provider of real-time rail network visibility, independently tracks all freight rail movements across Canada in real-time, including traffic flows through US/Canada border crossings. Data on traffic flows to the western ports region for export is available here.
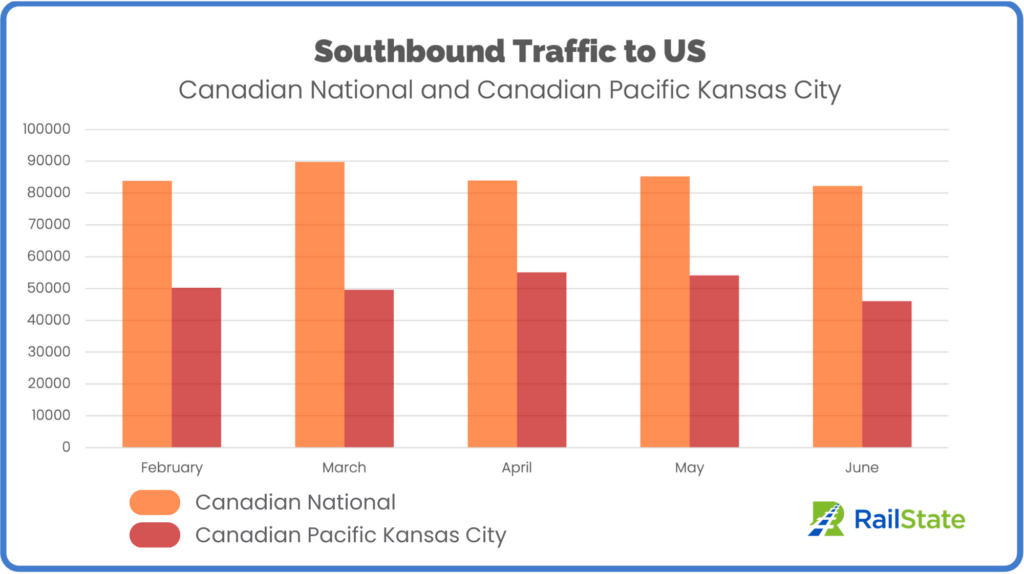
Total southbound traffic from Canada was 134,124 cars in February, 139,283 in March, 138,996 in April, 139,409 in May, and 128,285 in June. CN commands the majority of that traffic, 64.1% of total southbound traffic in June.
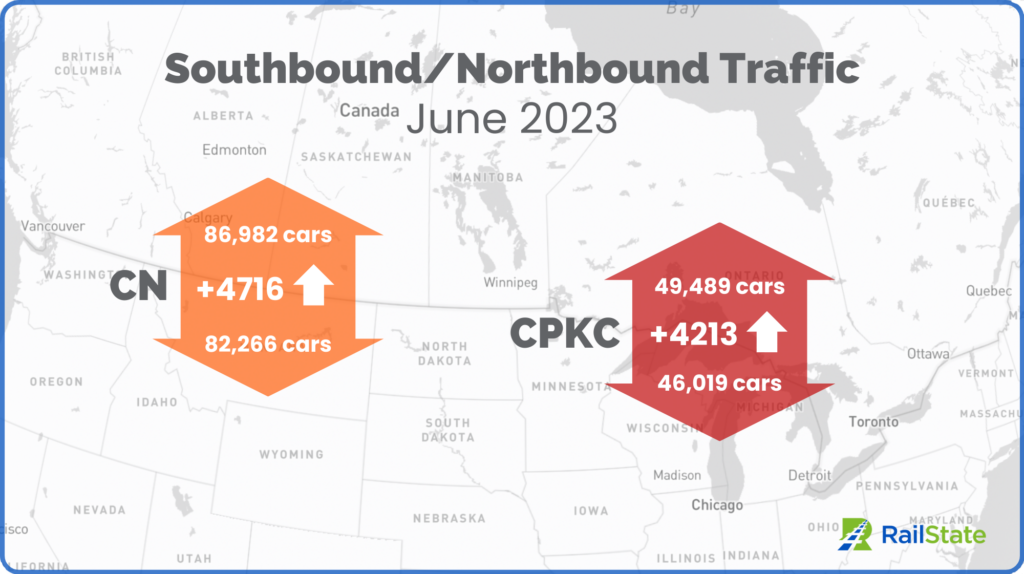
Total southbound traffic on CN in June was 82,266 cars, which was 3.5% lower than traffic in May (85,256 cars). CPKC showed a larger decrease in total southbound traffic from May to May, dropping 15%. Average daily southbound traffic for CPKC was 1533 cars per day, which is the lowest average daily southbound volume seen this year.
Northbound traffic into Canada outpaced southbound traffic in May, with 136,471 cars coming into Canada compared to 128,285 going to the US.
The busiest border crossings on CN-originated traffic were Port Huron, MI (41.1% of total CN southbound traffic), Fort Frances, ON/International Falls, MN (33.6%), and Blaine, WA/Vancouver-Seattle (via BNSF) (22.9%).
For CPKC, the busiest crossings were Windsor (34.0% of total CP southbound traffic), North Portal, SK (30.1%), Emerson, MB (15.7%), and Kingsgate, BC (12.9%).
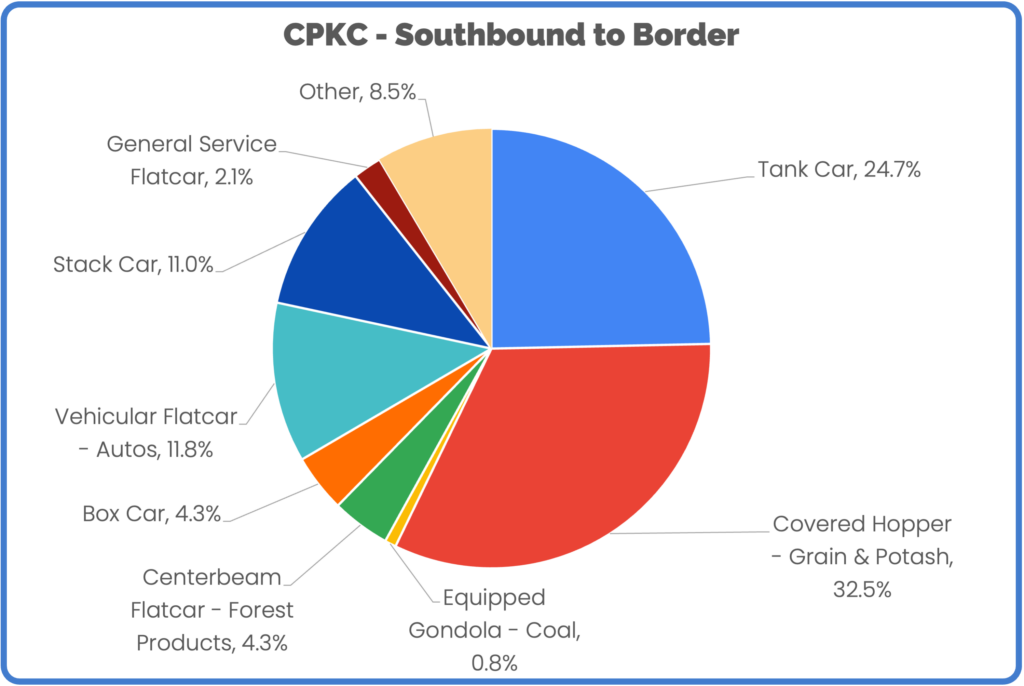
CPKC experienced a noticeable drop in the proportional volume of covered hoppers in June. Covered hopper volume landed at 32.5% of carloads moving southbound compared to 39.2% in May. Making up for the drop in covered hoppers was an increase in stack cars and general service flats increasing from 11.1% to 13.1% and vehicular flatcars jumping to 11.8% from 9.7% in May.
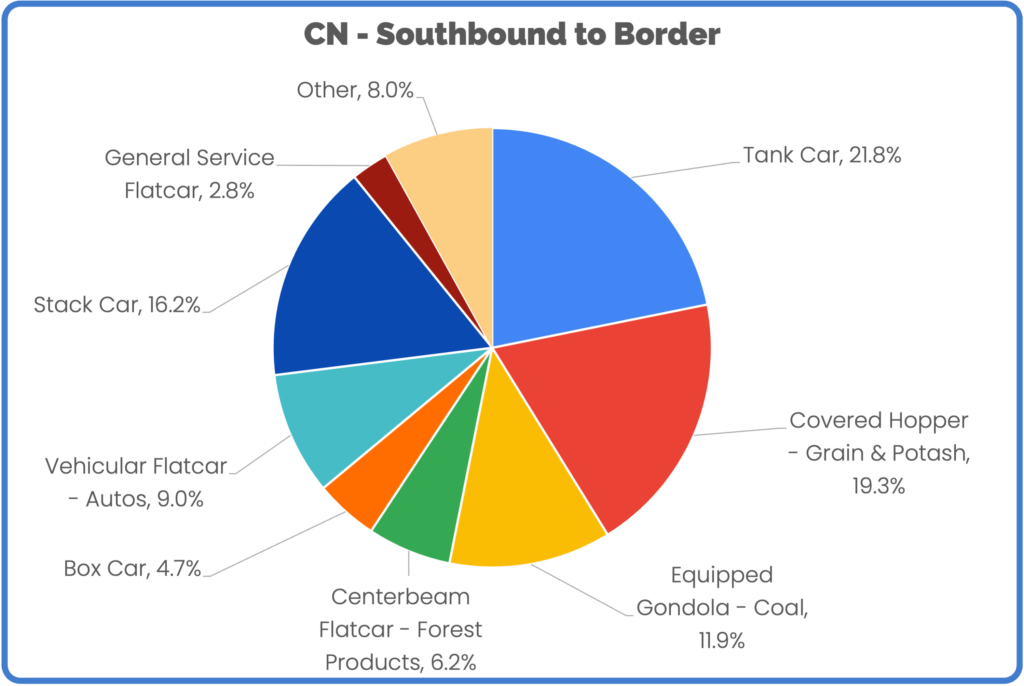
The largest changes on CN came in tank cars and stack cars. The percentage of stack cars moving southbound into the US on CN grew to 16.2% of traffic in June compared to 14.6% in May. Tank cars, on the other hand, decreased from 23.2% in May to 21.8% in June. All other car types showed negligible changes between May and June.
Schedule your in-depth demo today to explore how Rail Network Intelligence can unlock insights for your rail supply chain.
Take the uncertainty out of rail with the only independent source of data on train volumes, commodity flows, corridor performance, system bottlenecks, train lengths, and more.
Copyright © 2026 RailState LLC and RailState Services LTD