“Wayside Cameras, Integrated Sensors as Logistics Tools” – Railway Age
The digital age of telematic network monitoring comes in different business models. It might even help resolve passenger and freight train capacity questions. Jim Blaze takes a look at how cameras might displace or at least supplement confusing private spreadsheet calculations as to network capacity and fluidity, as well as help shippers adjust their railway routing options when certain rail routes become congested.
Amtrak had a few digital 24-hour camera eyes placed along the Mobile to New Orleans CSX freight route, trying to capture what is really going on since it has been “restricted” by legal maneuvers from using CSX’s proprietary traffic data and certain computer models used by consultants. Will such independent digital eyes catch on? Who’s going to be next?
From my experience, this kind of visibility monitoring of different networks has matured over the past several decades. In some ways, it’s hard to understand why private railway traffic flows have not yet been monitored by such means. This initial Amtrak approach to level the regulatory oversight data-based discussions in Washington at Surface Transportation Board hearings is an interesting technology approach. But for now it appears to be less-than-robust coverage.
Near-track-side camera coverage on a selected geographic basis can provide a reliable database as Amtrak tries to assemble a quality view of CSX’s claimed capacity restrictions that should keep the proposed new passenger trains off CSX tracks. Wayside off-CSX property line cameras could become the data equalizer for this regulatory discussion.
From my traffic network study experience, it’s about time someone like Amtrak decided to do this. But the initial Amtrak camera approach appears a bit sophomoric. There is a better way if Amtrak wants to create a more solid regulatory case.
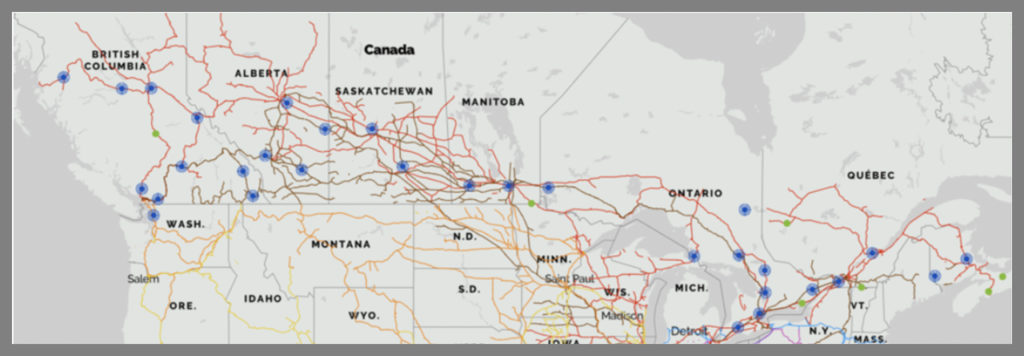
In Canada, a few shippers and some regulators are a step ahead of Amtrak and the STB in deploying such digital tool sets. I recently interviewed RailState Co-founder and Chief Commercial Officer John Schmitter as to how this works across his company’s networked system. RailState is a small start-up company. Its rail industry founders are James Heller and Schmitter. Their company’s private off-site cameras/sensors are located along the right-of-way of CN and Canadian Pacific strategic routes.
I have been following this company’s network rollout for about two years. Based on Schmitter’s responses to my questions, and my previous association with network monitoring systems including highways, I’d like to share the following observations with my Railway Age audience.
The primary observation is that in the digital/internet age of things, you can’t really hide the passage of freight and passenger train movements anymore. To try is absurd. Satellite images watching a war at ground level from miles above the terrain as in Ukraine demonstrates the power of digital camera monitoring.
But RailState does not require a satellite—not for a railway, bridge or even a highway network observing and evidence collection process. Instead, its camera images capture actual dated and timeed movement volume and speed and pattern numbers that actually can populate one’s spreadsheet cells with highly accurate and open sharing data. No more hidden calculations to confuse your opponent or a regulator during an investigative proceeding.
Schmitter shared the business use benefits: “There’s an enormous network visibility gap between rail and other modes of transportation,” he said. “Truck customers, with apps like Google Maps or Waze, cvan see the traffic effects of all trucks and cars on the roads. Ocean shipping customers can see every ship on the ocean. Air freight customers can see all planes in the sky.”
But on the railroads in North America? No, not actually very much network visibility. RailState “has a product to fix those rail freight black holes,” Schmitter said.
RailState is like Google Maps or Waze for the railroad. It can show you how much traffic is currently moving on a specific rail route, identifying train speed (or if a train has stopped moving), and the priority the railroad is giving your train vs. others. RailState helps level the playing field by making real time, independent, unbiased rail network data available to rail shippers, regulators, commodity traders, financial analysts and others.
One case that exemplifies RailState’s return-on-investment-based business approach is its work with Teck Resources Limited, one of the largest rail shippers in Canada. Teck was an early customer of RailState’s rail network visibility data. The steelmaking coal shipper wanted to understand the performance/health of the overall rail network in key corridors; measure their service and share of capacity relative to those of other railway customers; identify when key network segments approach or exceed capacity; and obtain early warnings of potential trouble on any of their rail routes.
In short, Teck wanted insights that would help their operations, both in “normal” times, and periods of disruption. They saw the value of RailState’s data, which provides insights that are not available anywhere else, according to RailState.
Teck relied heavily on RailState’s data during two vital periods: the Lytton, B.C. fires and washouts of 2021. During the Lytton fires, rail traffic stopped for multiple days. RailState’s real-time data quickly confirmed for Teck that traffic flow had stopped, impacting their shipments. Teck used this information to modify their shipping plans. They secured capacity in Prince Rupert and diverted multiple rail shipments—as well as a vessel—from Vancouver to Prince Rupert. To Teck, the business proposition was that they ultimately were able to react and thus preserve shipments, and act quickly to plan for others. RailState’s data also told Teck what priority the railways were giving to different trains once operations had resumed, and how long it took the railways to restore fluidity and reach the normal level of train volume for each train type.
Although disruptive, the 2021 fires demonstrated the value of RailState’s data in making game-time, money-saving decisions. The data helped Teck understand how the two carriers responded during major disruptions—an understanding on which they capitalized during the more severe B.C. washouts of 2021.
Unbiased, Third-Party Data
RailState’s data is unbiased because it is generated by and proprietary to RailState. The company’s sensors are located along the rail rights-of-way on private property, just not on actual railway-owned property. These sensors capture images of each car and create a profile of each train. They gather the passing time, direction, speed, and type of each train, and, using AI, they then develop information about the train and each of its cars. Their business intelligence tools report on every train—everything from car types to train consist, to the UN number on a hazmat placard. (A UN number is a four-digit number that identifies dangerous goods such as explosives, flammable liquids, oxidizers and some acutely toxic substances.) The result? A wealth of data and insights into the network.
Yet, railroad- and shipper-confidential data remains secure. There is no capture of sensitive waybill and other movement information such as rates and weights by customer or by detailed standard commodity codes.
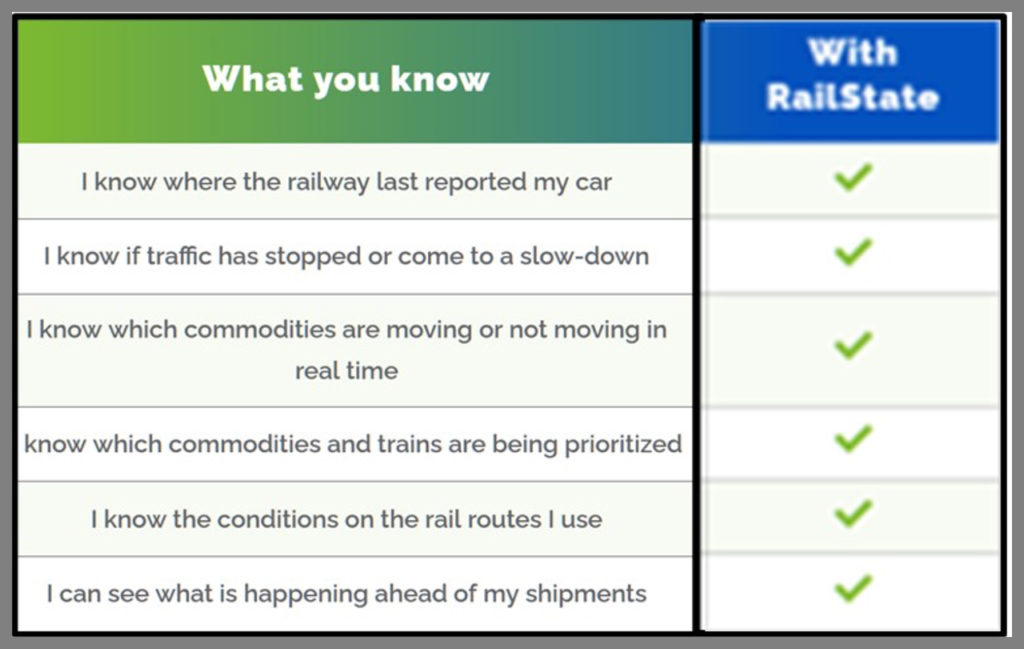
RailState’s data provides a birds-eye-view of the rail network. A subscriber can see how cars are moving; how they’re being prioritized; if there are slowdowns; and what can be expected moving forward. “You’ll be able to make decisions based on actual unbiased network data,” Schmitter noted. “For example, if you learn there’s been a slow-down at a certain point along the route, and nothing has moved for a day or two, you may consider other modality options for your next shipment. You can also have a more informed discussion with the railroad about what has caused the issue and planned actions to resolve it.”
It is also worth noting that RailState also provides real-time data on commodity movements for traders. With RailState’s data, traders have real-time info on commodity locations, movements and trends that can be identified by car type or perhaps selectively by track, and by the passage of selected car initials that are registered by third parties through customer or user agreements.
For example, a grain or ethanol trader can see real-time data on the movements of certain commodities or car types from origin to destination. A coal trader can see how many trains and cars have been delivered to export ports, electric power plants or other customers. When traders understand what impact rail operations will have on commodity movements, “they can trade with more confidence and efficiency,” Schmitter said.
Another major RailState subscriber is Transport Canada, which is using the RailState data in addition to other data to monitor the rail supply chain in Canada with unbiased, independent, and real time data. What do they get? Fewer surprises. Greater transparency and communication. USDOT, FRA and the STB don’t have the same visibility as Transport Canada.
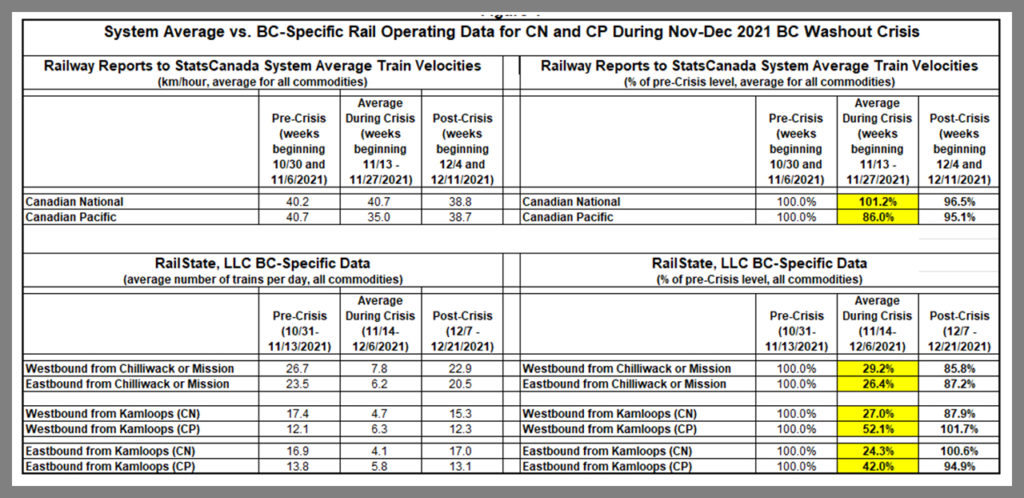
Screen shots like that of Table 1 shows the RailState British Columbia flood damage 2021 intel reporting offered by this monitoring service. RailState’s track monitoring assets and communications network tracked the actual movements of trains before, during and after the regional rain/floods three-week crisis period. Their data identified the number of trains per day passing either Chilliwack (on CN) or Mission (on CP), both points just east of Vancouver. You can see that, while train flow was 25-50% of normal through this corridor while the railways recovered, the system average train speed reported to regulators didn’t change much.
In a second analysis, the RailState network recorded a Nov. 14-Dec. 6, 2021 period where volumes passing Chilliwack or Mission dropped to nearly zero for a nine-day period, and then captured in real time how the rail service rebounded gradually over the following weeks.
During that crisis period, some of the parties that relied upon RailState had much better clarity as to the scope of the disruption. Subscription access provided those few shippers with rapid independent verification of “what’s going on out there?”
Schmitter spoke at an FTR Transportation Intelligence webinar a few months ago, and a key participant told him that “knowing the railroad’s system-average train speed went from 24 to 25 mph two weeks ago has never helped me sleep better at night.” Why? Because those statistics lack major granularity.
There are some averaged train type performance statistics available for a weekly summarized look on the STB website. That data set divides the data into several broad train types, for example. But, the public STB on file data doesn’t go deep enough to achieve network visibility.
In Canada, these issues have been resolved. Already, much of the strategic Canadian rail network is covered by RailState.
After you collect the network movement or blockage data, what then? You convert these “field events” to monetized opportunity (or loss) values. Tie it all together into a financial impact message. As a rail economist, I find this very useful.
Next Up?
There could be a potential explosion of such strategic coverage to a number of critical bottlenecks on of Class I railroads across the U.S.—eyes in the fields as opposed to eyes in the sky. What should be covered?
As an economist, I believe that, initially, the top five grain, top eight coal and top 12 intermodal routes might be a useful train fluidity monitoring coverage. That’s based upon my five decades of covering U.S. strategic commodity flow corridors for Conrail and later for others. This cuts out the old fashioned way of doing such surveys via the “windshield” train counting approach I first used for the Illinois DOT back in 1968. Too much manual effort. Prepositioned private cameras are much easier.
Schmitter didn’t reveal by when and over what links RailState might start to cover sections of the U.S. rail network. But he did allow that they have been examining certain U.S. lanes. One of them could be the contested CSX-Amtrak New Orleans to Mobile corridor. They could quickly instrument that route and provide superior overage about capacity utilization versus Amtrak’s single-camera test coverage tried this past summer.
Here into the autumn of 2022 are some blogged public service assessments offered by RailState, which has been offering a sample weekly reporting about Canadian traffic moving into and out of the important Vancouver Canadian market. Figure 3 is an image from late in September 2022. Figure 4 is an image of the same traffic section data mid-October. These calculated Vancouver route capacity metrics and changing weekly averages are part of the available baseline and variable diagnostic history.
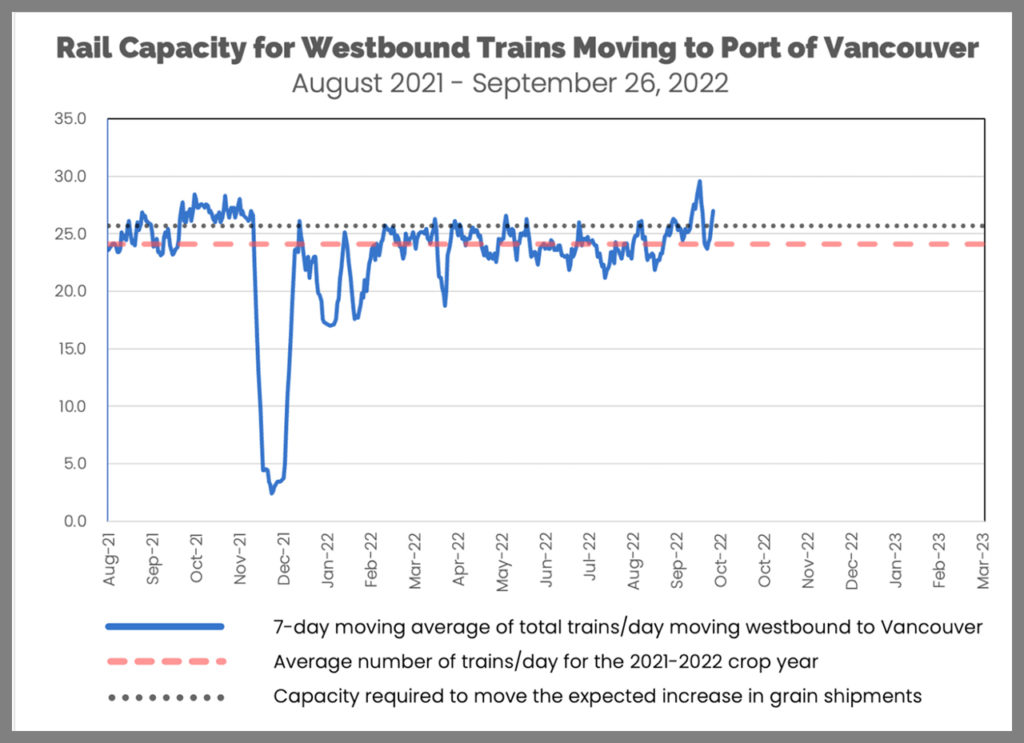
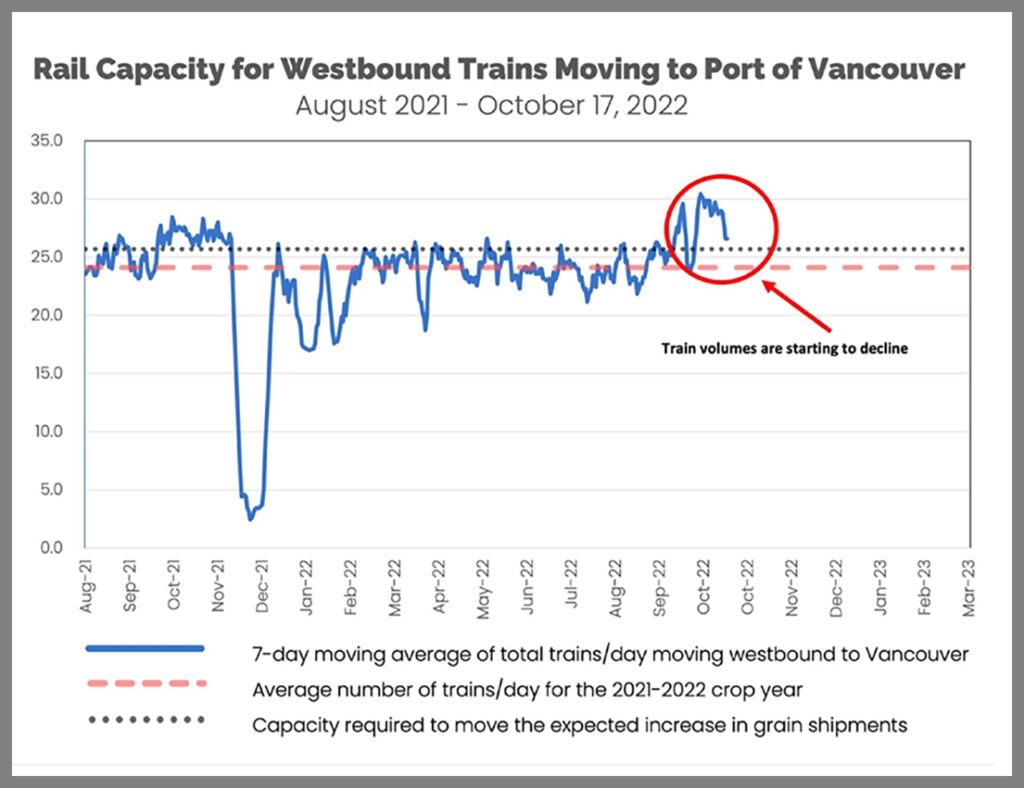
These calculated Vancouver route capacity metrics and changing weekly averages are part of the available baseline and variable diagnostic history.
How is grain traffic doing right now? That’s certainly an interesting question given the global grain crisis as the Russia’s assault on Ukraine continues. According to the overall Canadian RailState reporting, the latest network summary shows that during the past four weeks, the railways have appeared to be doing well movement toward Vancouver. Total train volume is above the 25.7 trains/day required to move the current grain harvest and the typical volume of other commodities. Most of the additional trains above the year-to-date average are grain trains.
RailState estimates that about 5 grain trains/day are required to move the expected grain harvest. For the past week, the railways moved 7.7 grain trains/day. That is down from about 9 grain trains/day in early October. This past week, the volume of coal trains was 4.1 trains/day, vs. a longer-term average of 5 trains/day. This is the fourth week in a row during which coal shipments have been below the long-term average. Manifest trains (2.6 trains/day) and intermodal trains (6.6 trains/day) had also fallen slightly below the longer-term averages for those categories of traffic.
A Few Key Questions
Would a regulatory agency or a court try to block the off-rail property (but adjacent) overview technology? And if so, why? That invasion of property argument seems to have been resolved in Canada. So why would it be an issue in the U.S.?
How would state economic/transport planners and the feds use this higher intel independent monitoring data? Do they have a priority need in mind yet, such as independently assessing rail capacity and bottlenecks like they can do for the other modes.
My takeaways:
A statistically significant camera coverage network, linked together with communications and analysis software, can in fact give a meaningful commercial network assessment of fluidity and service capability to shippers and other interested parties. Network fluidity camera coverage has been developed elsewhere and proven its business case utility. This is not a brand-new approach, except for rail freight.
Possible use of this method to assess the Amtrak/CSX disputed route coverage would not be a first time R&D use of the technology. The rail industry has passed the milestone. Thus, by using Railstate as a vendor, Amtrak and others could take advantage of its machine learning and AI data analytics that provide measured insights as to what the cameras have recorded. The legal issue is most likely whether the STB would permit this date to be used in an administrative hearing.
RailState does have competition. There are other telematic sensor and networking options. So, as always, check to see what other technologies and providers could provide the best network visibility. Depending upon the problem, you’ll have to make choices.
As always, I welcome your opinion, even if contrary.

Independent railway economist and Railway Age Contributing Editor Jim Blaze has been in the railroad industry for close to 50 years. Trained in logistics, he served seven years with the Illinois DOT as a Chicago long-range freight planner and almost two years with the USRA technical staff in Washington, D.C. Jim then spent 21 years with Conrail in cross-functional strategic roles from branch line economics to mergers, IT, logistics, and corporate change. He followed this with 20 years of international consulting at rail engineering firm Zeta-Tech Associated. Jim is a Magna Cum Laude Graduate of St Anselm’s College with a master’s degree from the University of Chicago. Married with six children, he lives outside of Philadelphia. “This column reflects my continued passion for the future of railroading as a competitive industry,” says Jim. “Only by occasionally challenging our institutions can we probe for better quality and performance. My opinions are my own, independent of Railway Age. As always, contrary business opinions are welcome.”
Additional Commentary by David Peter Alan, Contributing Editor
The technology that Jim Blaze explains in the above article could also be useful in situations where Amtrak (or another entity, such as a state agency) proposes running a new passenger service, or expanding an existing one, and the host railroad on whose lines the proposed train(s) would run resists the proposal. One example is the ongoing dispute between Amtrak and CSX, Norfolk Southern and the Port of Mobile before the STB over proposed trains between New Orleans and Mobile.
One of the most thoroughly argued issues in the STB matter is the use of the Rail Traffic Control (RTC) model to determine how much infrastructure (if any) must be added to the existing Mobile & New Orleans line (part of CSX) or the New Orleans Back Belt (part of NS) before there would be room for the proposed trains without unduly interfering with the freight on CSX or NS. There has been considerable controversy over how useful the RTC model would be in the case, and Amtrak has questioned its validity for the purpose, claiming that it is based on proprietary information that belongs to CSX and NS.
While the two prospective host railroads argue that it would take a lot of expensive infrastructure projects to generate enough capacity for the proposed trains, Amtrak disputes that contention and has stationed a time-lapse camera along the route, in an effort to demonstrate that few CSX freight trains are actually using the line, so CSX underestimates its capacity.
In effect, the camera is “eyeballing” the line from a station platform. That generates some useful data about when the CSX trains go by, but the technology that Blaze describes can tell Amtrak, the STB and anyone else concerned (the FRA?) much more.
It would not be necessary to gather all the information a shipper would want, because it is only information about the freight trains themselves that matters. Tracking the line at issue would require sensors at several locations, because it would be necessary to know where freight trains originating and terminating at different O/D pairs and local freights that stop along the way to pick cars up or drop them off are going, and when they pass by each data collection point.
It appears to me that the necessary information includes the length of each train (by number of cars and locomotive units) when it passes each data collection point and its speed at that time. With that information and a track plan, it should be possible for Amtrak or another concerned entity to map the progress of each freight train on the line, which would reveal how much capacity the potential host railroad is using in real time. With a track map that shows speed limits on each segment of the line in question, it should be possible to determine the amount of available capacity on that line, as well as how much of it is used.
With sufficiently accurate information about the line’s capacity and its utilization, it would not be difficult to construct models that would include proposed passenger trains. With that information, the STB would be able to determine what new infrastructure, if any, must be built to accommodate the passenger trains. That might require the expert assistance that the FRA can bring to the table, so it makes sense that the FRA should be informed, too. The FRA could even set up the sensing devices.
It does not appear that my suggestions would misuse any proprietary information that a potential host railroad would need to keep confidential, since there would be no need to know who is shipping what and to which destination. It would also not require any of the sensing devices to be located on railroad property, only near enough to keep track of the trains, so there would be no intrusion.
It appears that everyone concerned could have reliable and valid information about capacity using this technology, and the route between Mobile and New Orleans seems like the ideal place to test it.