Rail Volume Report: US Southwest December 2023

RailState, the rail industry’s only provider of real-time rail network visibility, independently tracks freight rail movements across North America in real-time.
This report covers train and intermodal container movements on Union Pacific and BNSF railways in the southwest United States.
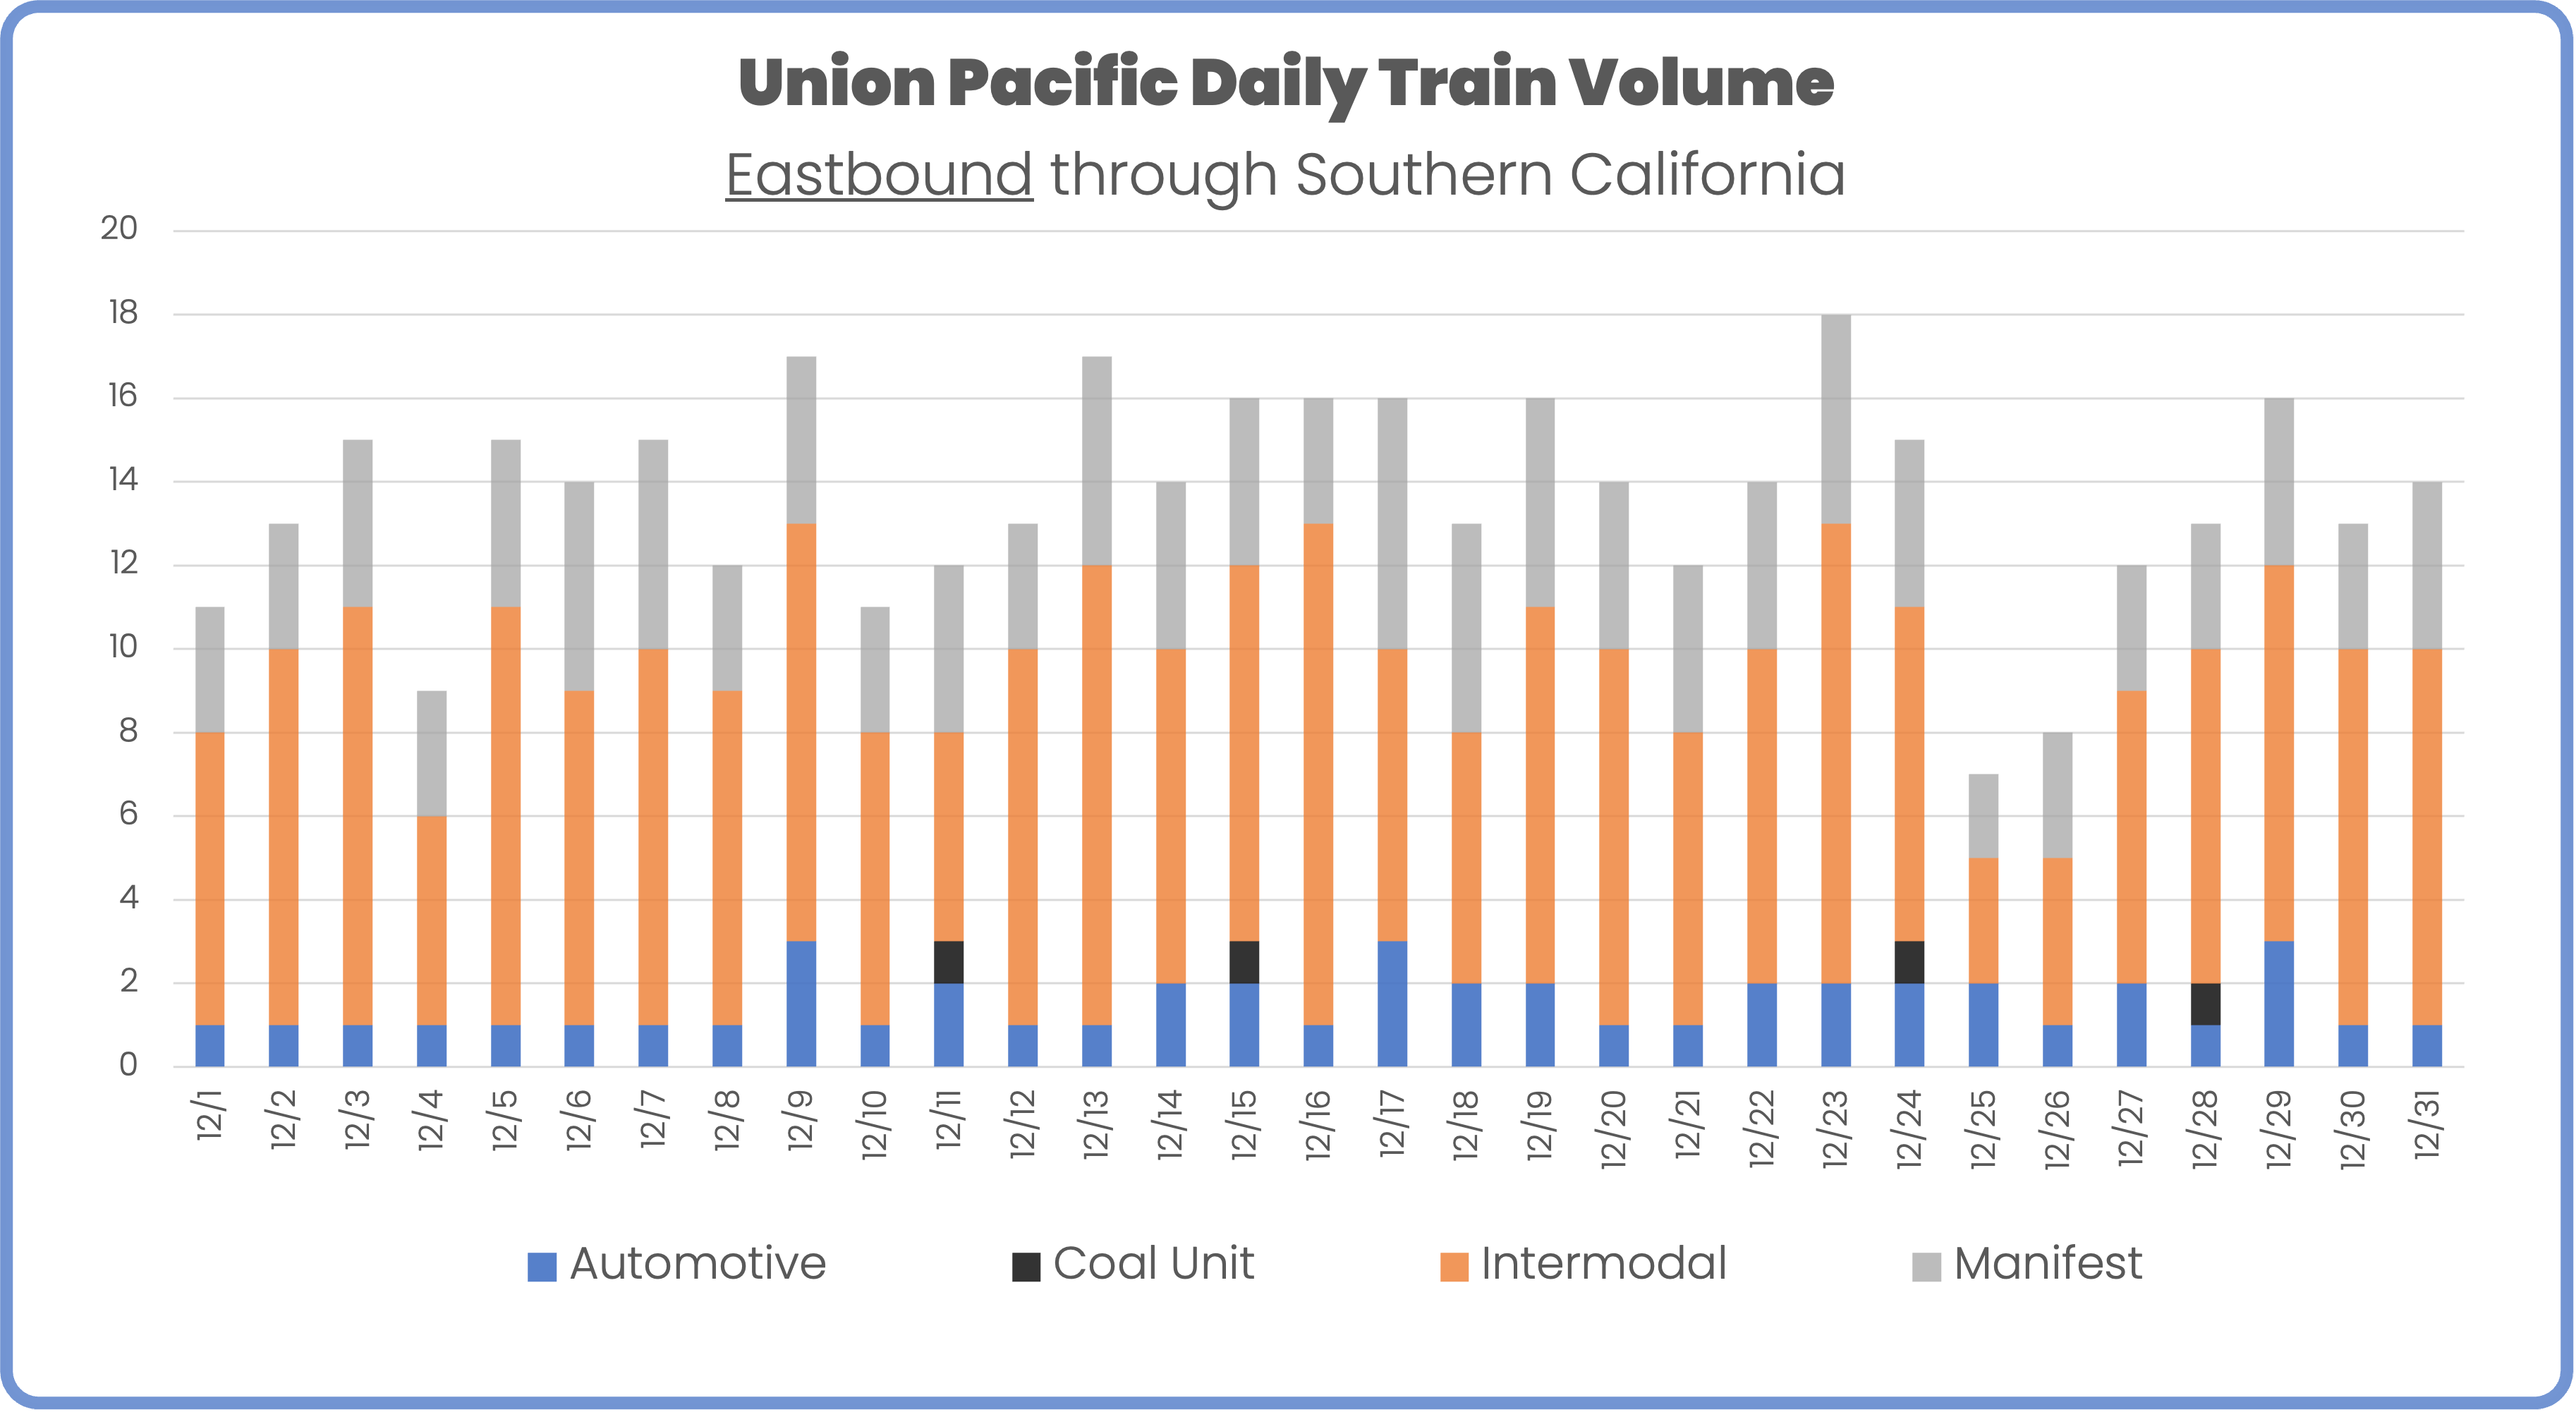
In December, daily train volume on UP through southern California averaged 13.6 trains per day, down slightly from an average of 14 trains per day in November. Of those, 60% were intermodal, 28% were manifest trains, and the remainder were predominantly automotive trains. Intermodal volume accounted for 61% of traffic in November and 65% of traffic in October.
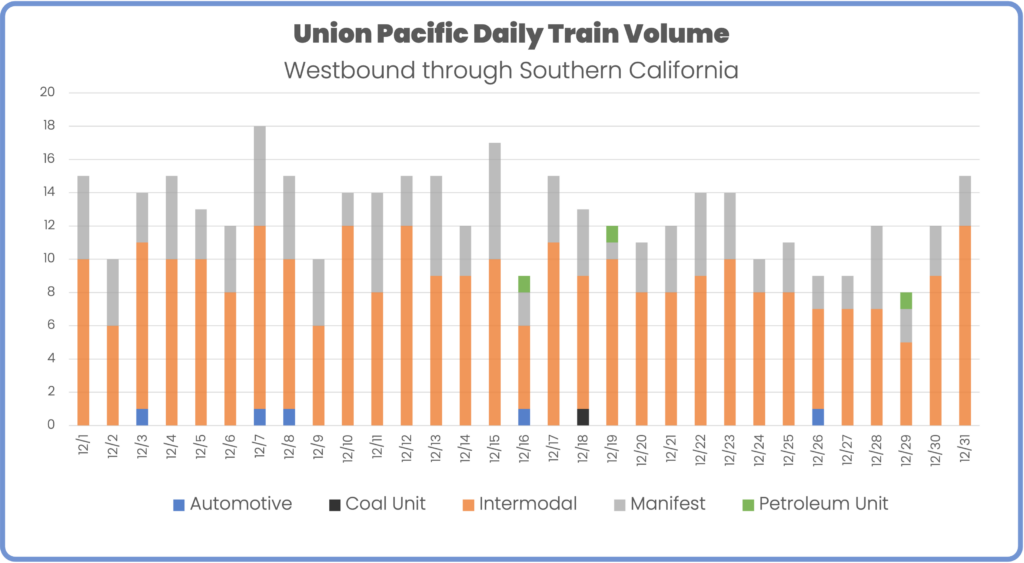
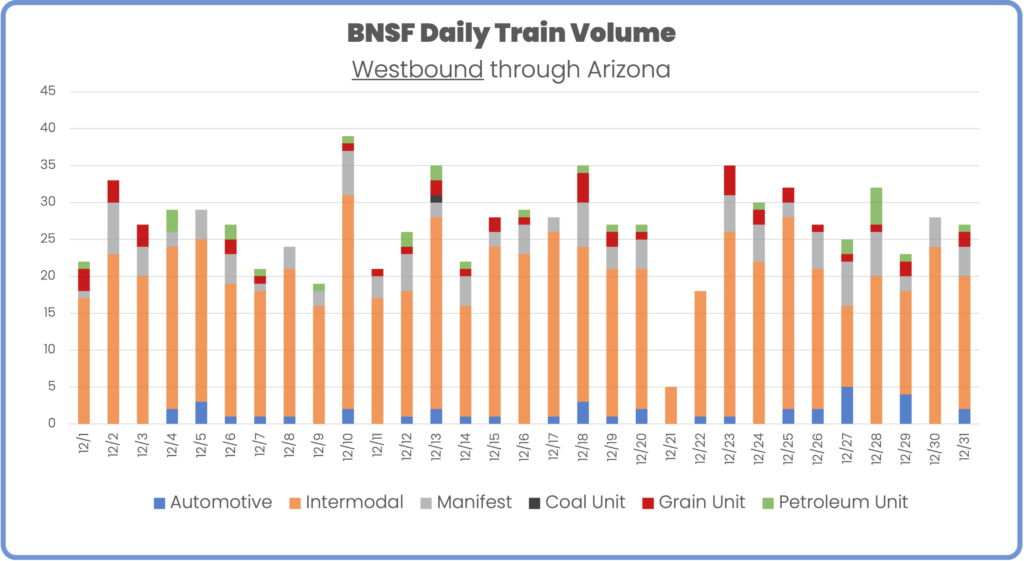
In the westbound direction, there is an average of one fewer train per day (12.7) compared to eastbound. Intermodal trains account for 69% of volume, manifest 29%, and the small remainder made up of mostly automotive trains.
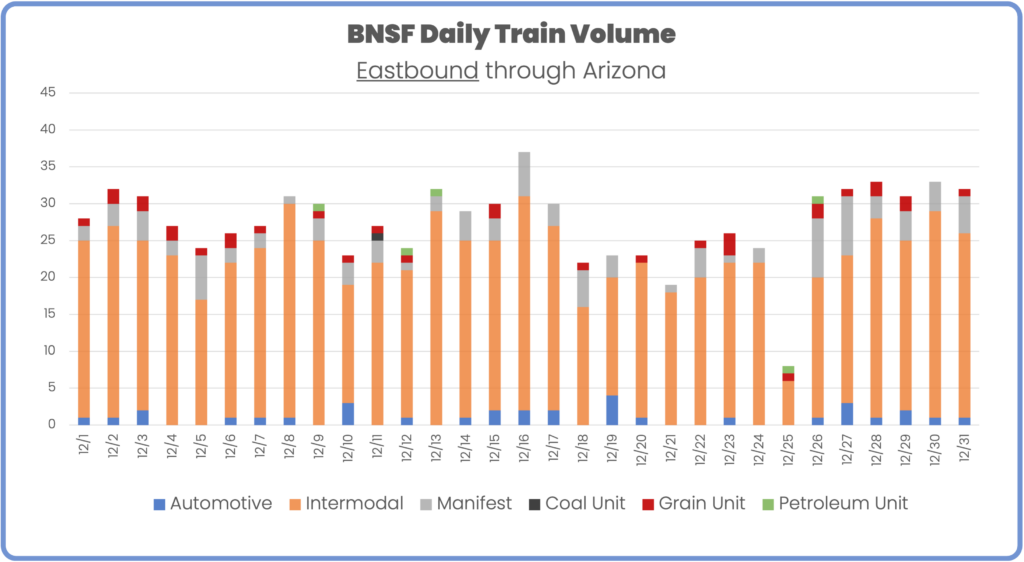
BNSF moved an average of 27.4 trains per day eastbound in November (up from 25 per day in November). Intermodal trains made up 80% of eastbound traffic through Arizona. Manifest trains account for 11.5% and the remainder of trains are a mix of automotive, coal, grain, and petroleum trains.
In November, BNSF moved an additional train per day westbound compared to the eastbound direction. December saw the opposite trend with slightly more than half a train per day moving eastbound. Intermodal makes up a slightly smaller percentage of trains moving westbound on BNSF, 73.6% compared to 80% in the eastbound direction.
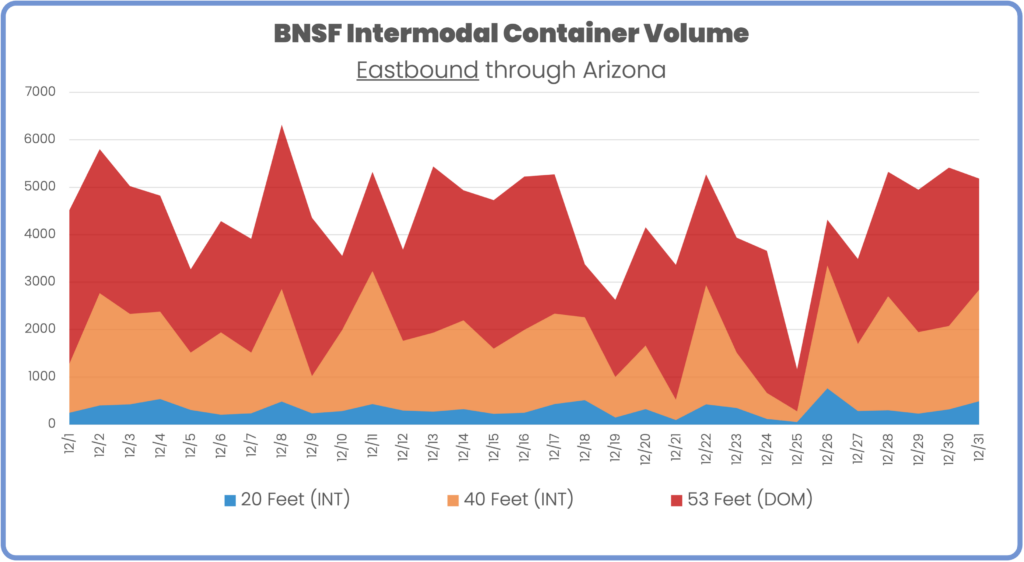
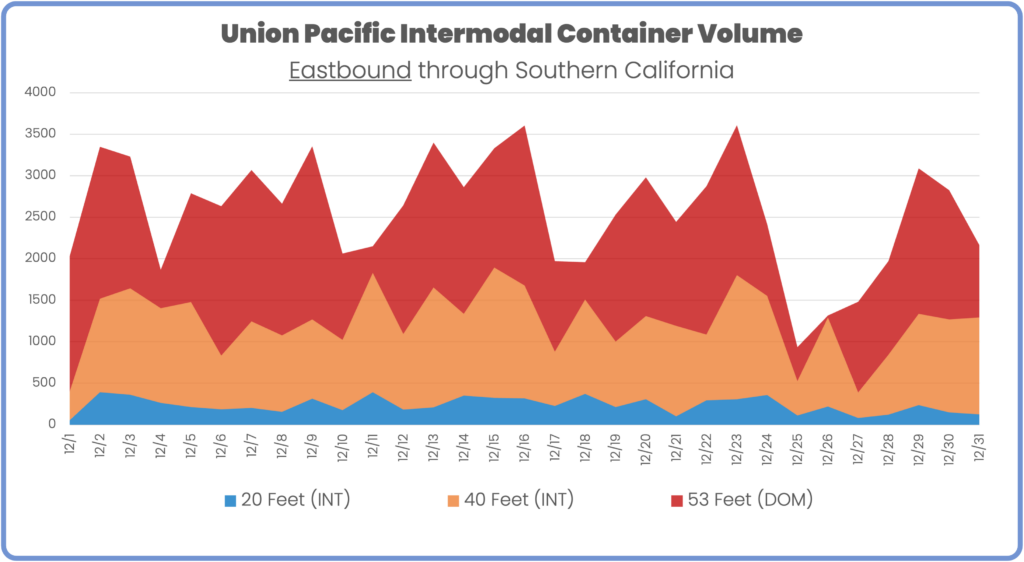
Union Pacific moved 79,598 76,191 containers eastbound through southern California in November, 51.4% of which were domestic containers. Compared to November, there was an overall increase of nearly 3500 containers moved, and the proportion of domestic containers dropped nearly 6 points from 57%.
In November, BNSF moved 136,697 containers eastbound (up from 125,771 in November), 56% of which were domestic containers (down from 60% in November).

Total container volume last month on both lines was 216,295, with BNSF moving 63.2% of total container volume and 65.2% of domestic container volume.
Schedule your in-depth demo today to explore how Rail Network Intelligence can unlock insights for your rail supply chain.
Copyright © 2025 RailState LLC