Canada Intermodal Rail Volume Report: March 2024
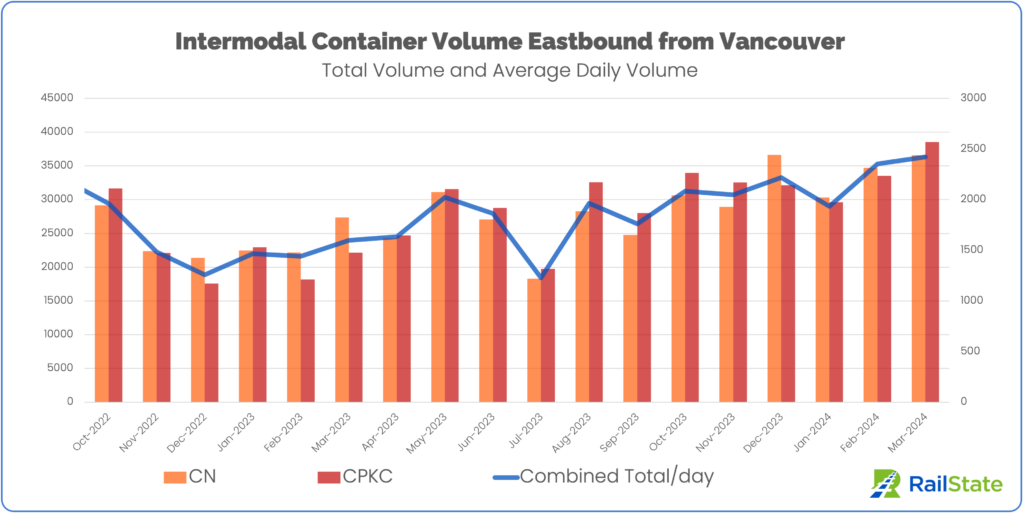
Surge in Imports Stresses Train Capacity
Intermodal volume from the Port of Vancouver hit its highest level since August 2022, with a total of 75,110 containers moved eastbound. This is a 10% increase over February and a 39% increase over the average monthly container volume throughout 2023. Compared to March 2023, monthly container volume was up 51.7%.
Intermodal volumes have been on a steady increase since the beginning of 2023, only interrupted by a dockworkers’ strike in July and a stretch of extreme cold in January. March capped off a booming quarter, which saw total intermodal performance 50% higher than Q1 of 2023.
Between the carriers, CPKC moved slightly more containers than CN, accounting for 51.3% of total container movements out of Vancouver.
Current Status
In late March, Hapag-Lloyd provided guidance to customers stating:
“All marine terminals in Vancouver continue to manage through heavy congestion, resulting from an inadequate supply of rail cars from major Class 1 railways . . . We expect this situation to continue into early April.”
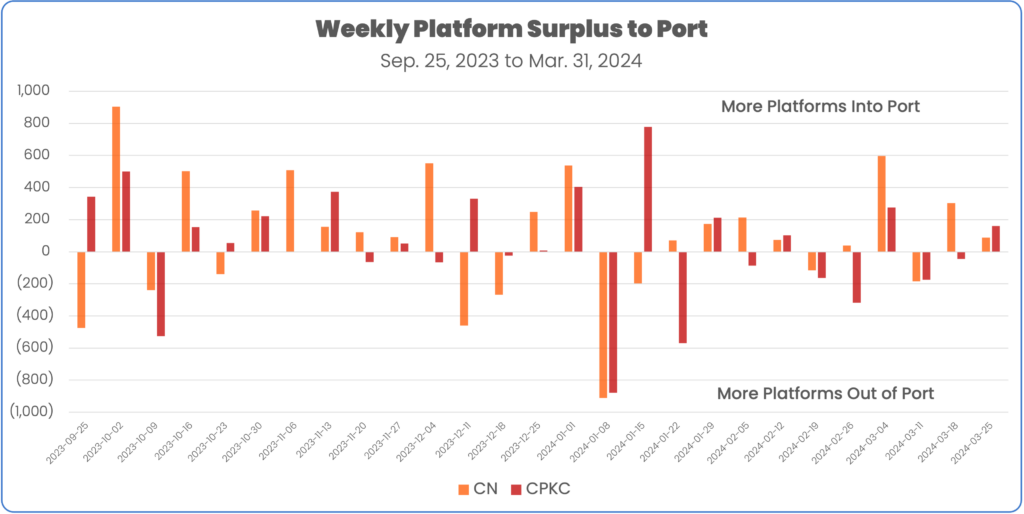
In recent weeks, more container platforms have moved into the port than out the port region. Last week, CN moved 88 more platforms westbound into the port and CPKC moved 161 more westbound.
Recent Surplus of Westbound Platforms v. Eastbound | ||
Week | CN | CPKC |
3/25/24 – 3/31/24 | 88 | 161 |
3/18/24 – 3/24/24 | 303 | (45) |
3/11/24 – 3/17/24 | (184) | (174) |
3/04/24 – 3/10/24 | 597 | 276 |
6-month weekly average | 91 | 39 |
With the existing high dwell times at the Port of Vancouver and increased import volume in the short-term forecast, this car capacity will be needed to clear congestion.
Heavily Packed Trains
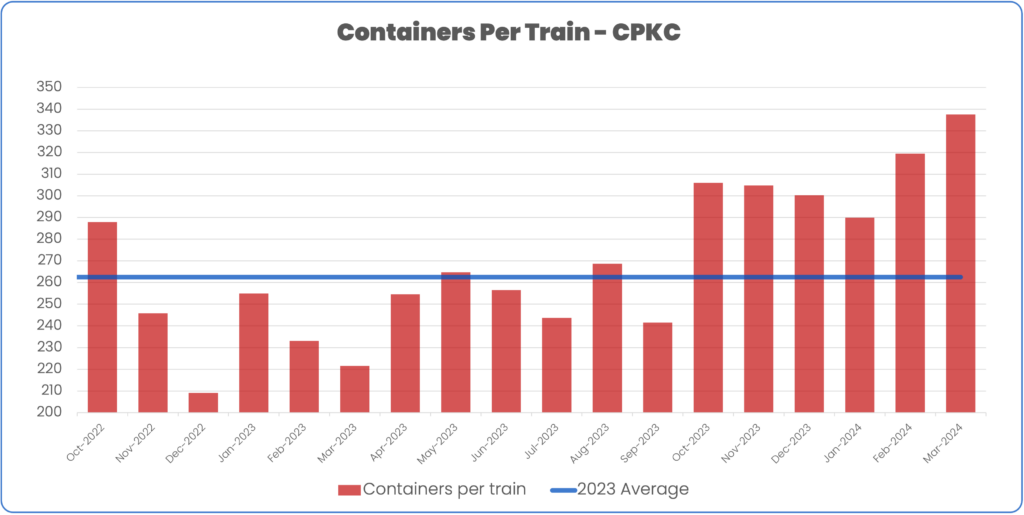
Canadian Pacific – Kansas City
CPKC increased train size by 11.1% and containers per platform by 16.3% to carry 341 containers per train in March. That’s 76 more containers per train (+29%) than the 2023 average, and 120 containers more per train (+54%) than March 2023.
First quarter performance was up 35% in containers per train compared to Q123.
Canadian National
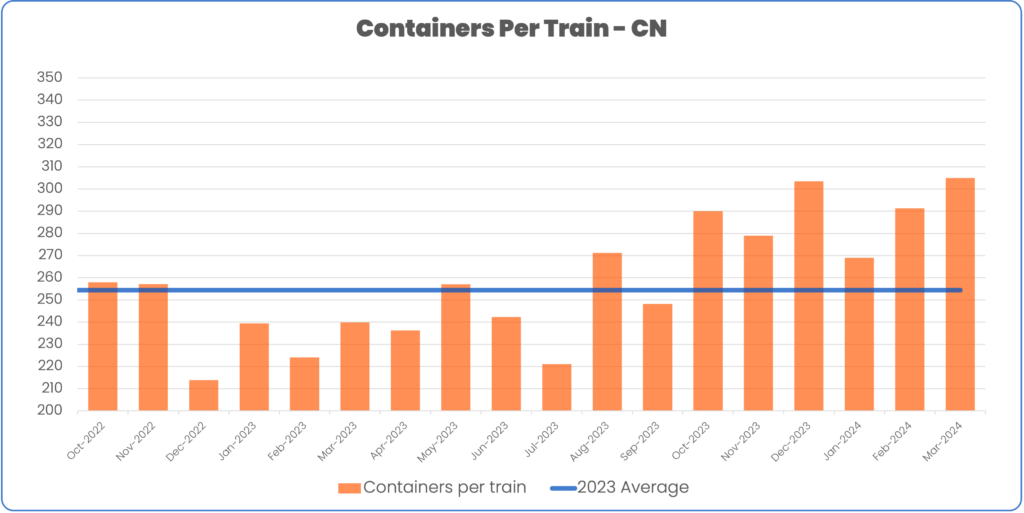
CN moved slightly larger trains in March, with platforms up just 5.2% from the 2023 average.
A 14.5% in platform utilization resulted in 307.5 containers per train in March. That’s 52 more containers per train (+20.3%) than the 2023 average, and 67 more containers per train (+28%) than March 2023.
First quarter performance was up 24% in containers per train compared to Q123.
Moderate Changes in Train Volume
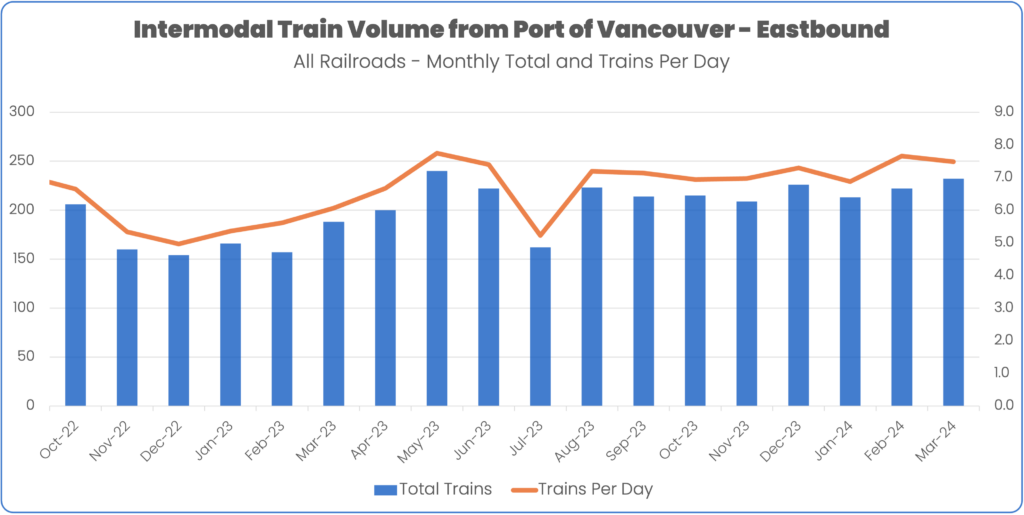
Daily train volume was up 13% compared to the 2023 average, despite a small decline in daily volume from February (7.48 trains per day compared to 7.66).
This growth in train volume with an increase in platforms per train (+5%) and a larger change in containers per platform (+15.4%) combined to provide the needed capacity to move the overall container numbers.
Train Mix
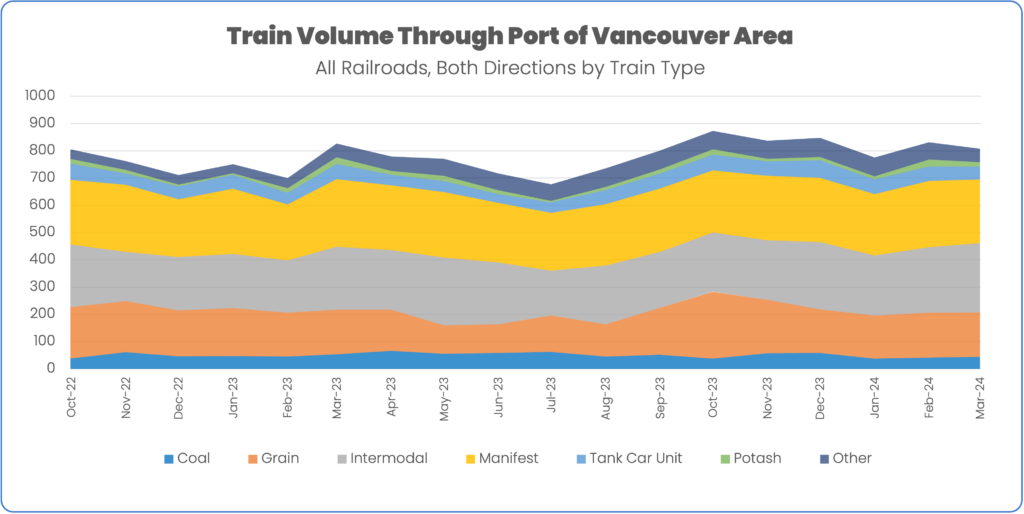
Intermodal trains as a share of total train volumes through the Port of Vancouver area accounted for 31.4% of traffic in March.
Intermodal was the only train type to see a notable increase in the share of total train traffic, growing 12.5% above its average share of traffic for 2023.
Coal trains (-15%), tank car unit trains (-14%), potash trains (-32%) declined the most as a share of traffic compared to 2023.
Prince Rupert
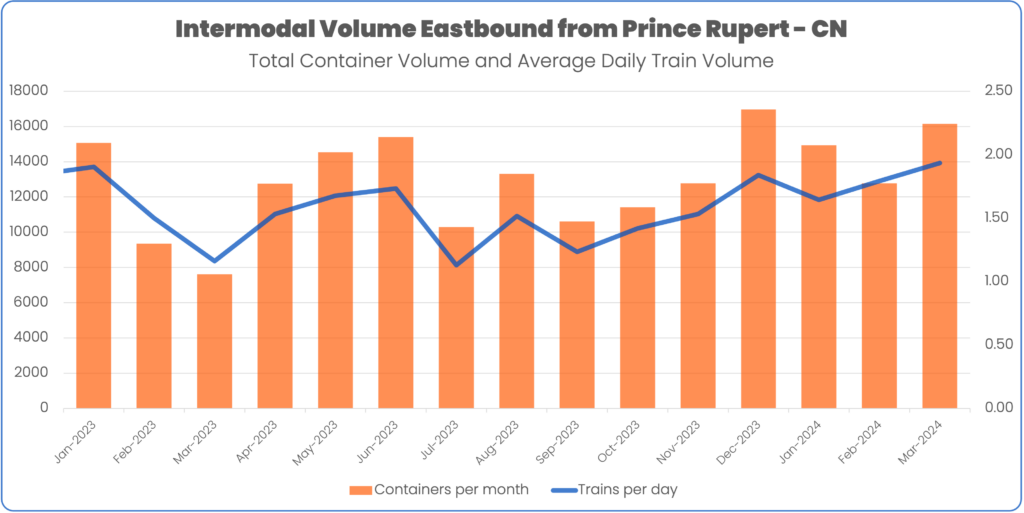
Total container volume hit 16,148, an increase of 26.5% over the previous month and 29.1% over the average monthly performance for all of 2023.
CN ran more trains per day (+7.9%) with more platforms (+8.4%) in March than in February while keeping containers per platform largely unchanged (+1.1%).
For additional information about this report or to receive other updates from RailState, please reach out to contact@railstate.com or subscribe to our blog.
