Rail Volume Report: US Southwest March 2024

RailState, the rail industry’s only provider of real-time rail network visibility, independently tracks freight rail movements across North America in real-time.
This report covers train and intermodal container movements on Union Pacific and BNSF railways in the southwest United States.
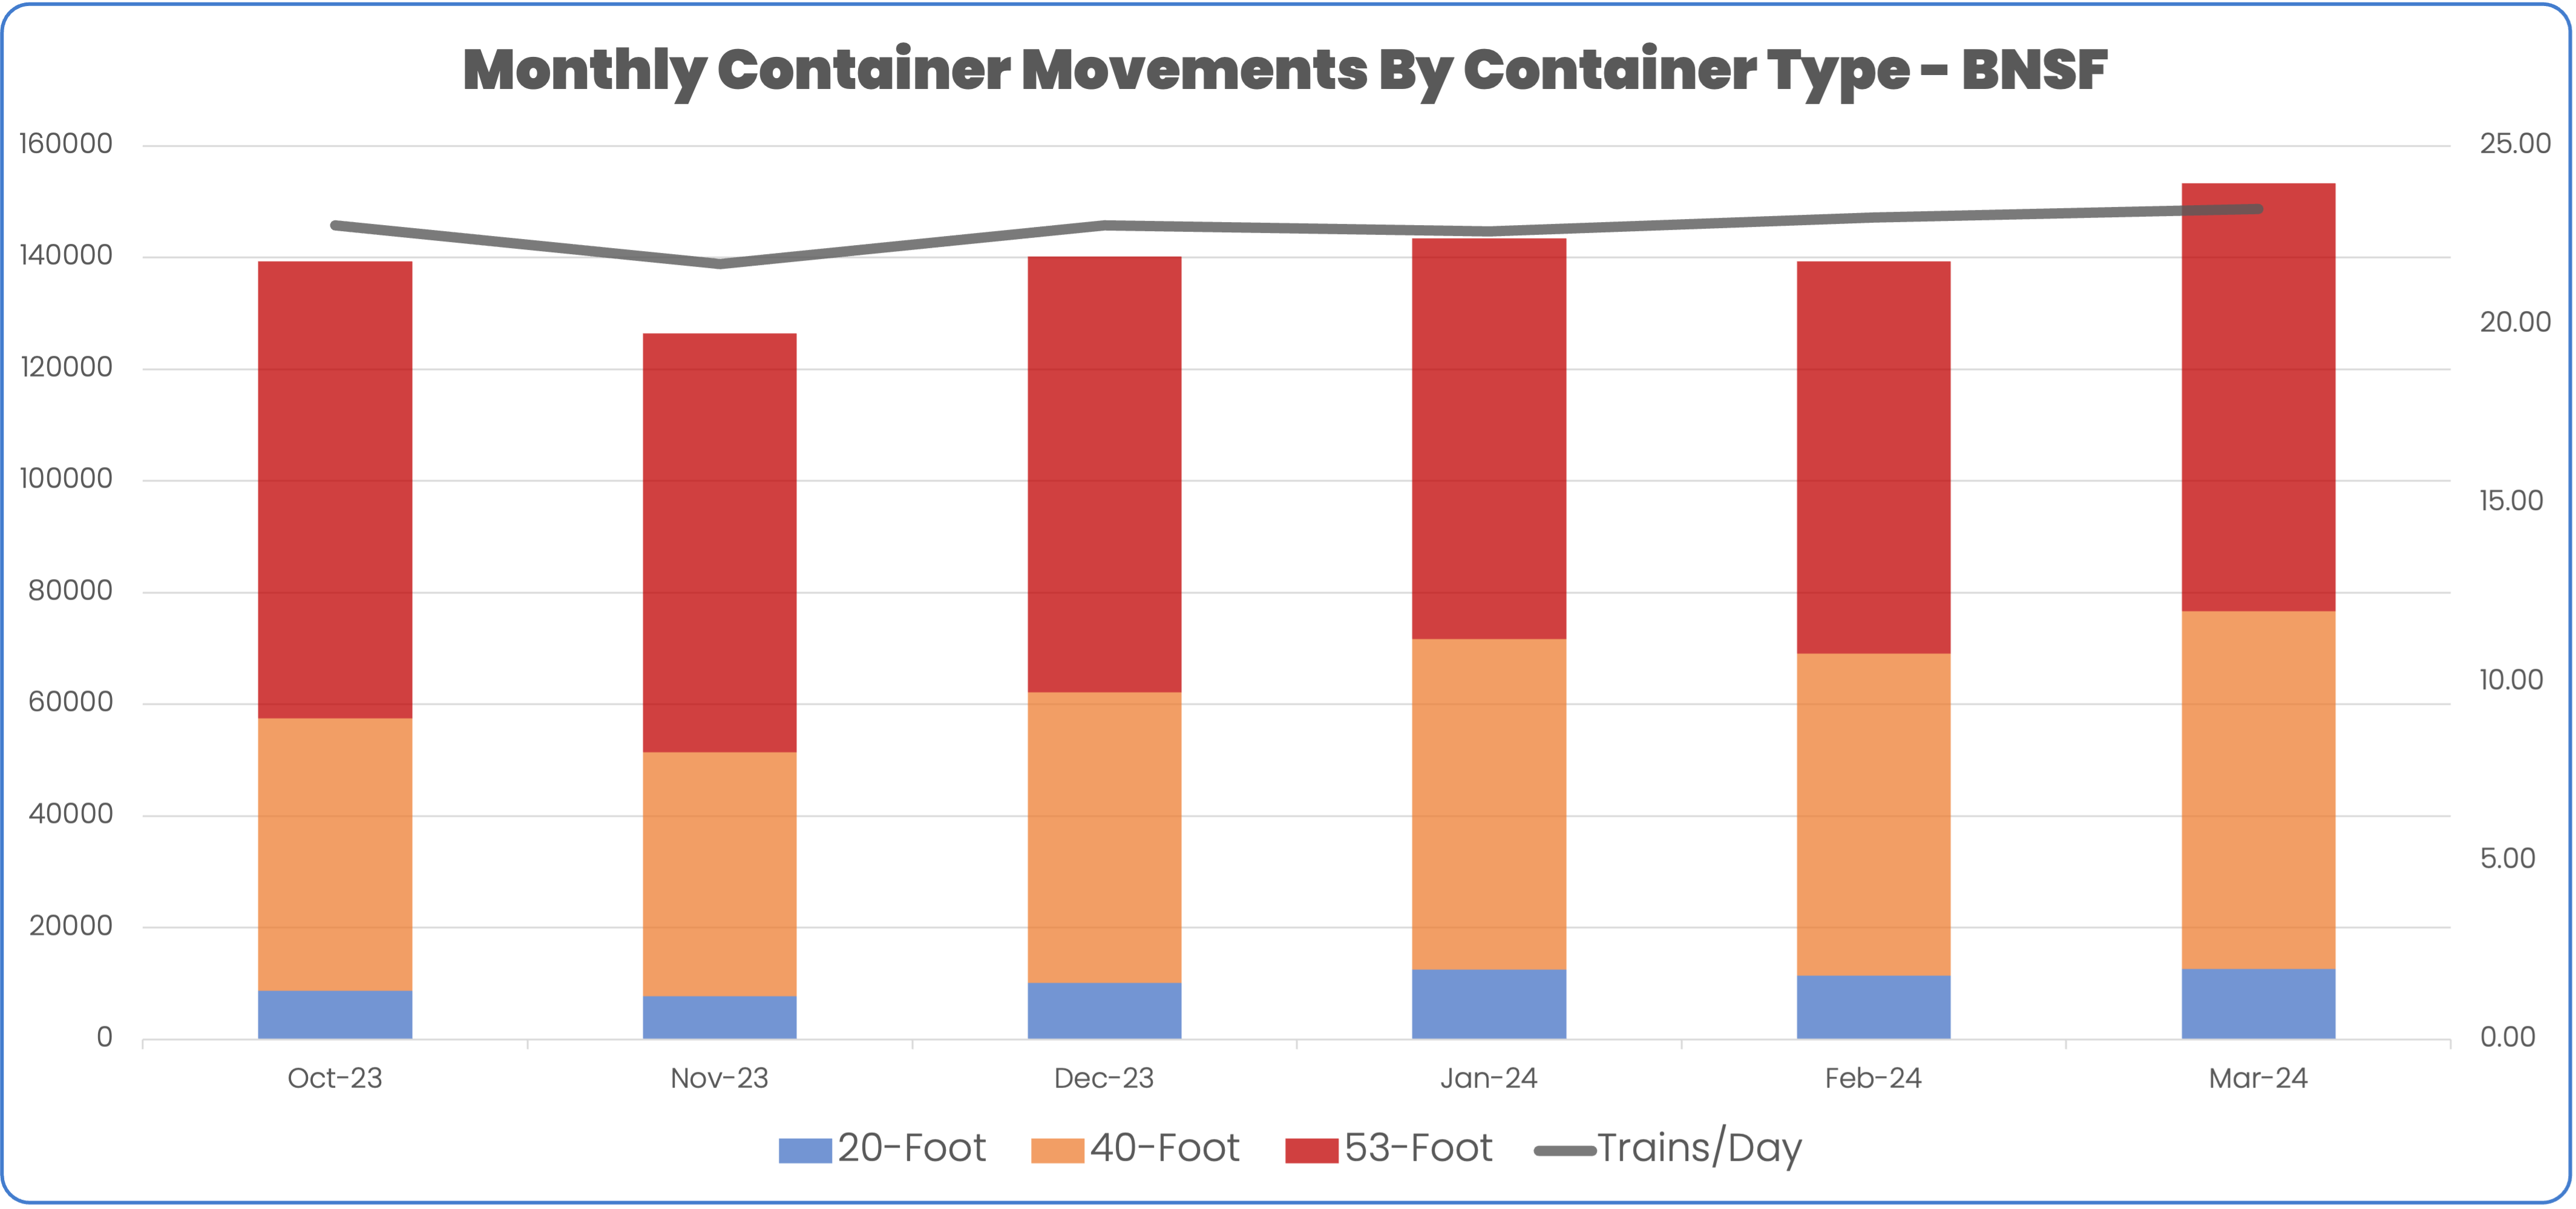
March was the strongest month for eastbound container movements in the past six months. BNSF and UP moved 243,133 containers combined, an increase of 10.4% over February.
Note: RailState’s network coverage of this region is more recent and does not include earlier historical data.
BNSF
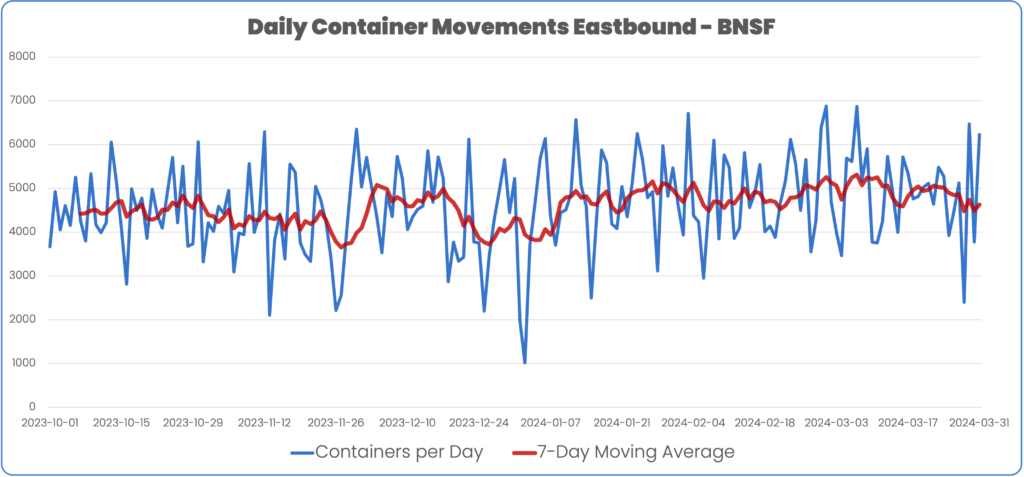
In March, BNSF moved 153,310 containers eastbound, up from 139,204 in February. This is the highest container total in the past six months and reflects the influx of imports to the western ports. BNSF carried more containers in March by running more trains (23.2 trains per day) and carrying more containers per train than in the past six months (213 containers per train).
The daily container movement of 4,985 containers per day was a 3% increase over February.
Train volumes heading westbound on UP were slightly higher than the eastbound volumes, averaging 12.7 trains per day, with intermodal accounting for 68% of trains and manifest representing 31%.
Other Train Movements
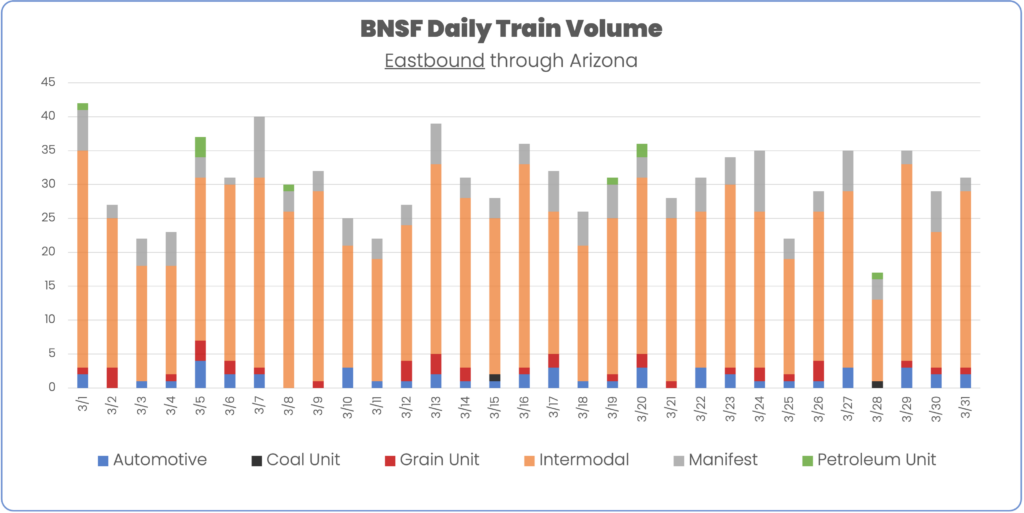
BNSF moved an average of 30.4 trains per day eastbound in March, up more than a train per day than February (29.1 trains per day). Intermodal trains made up 76.5% of eastbound traffic through Arizona in March.
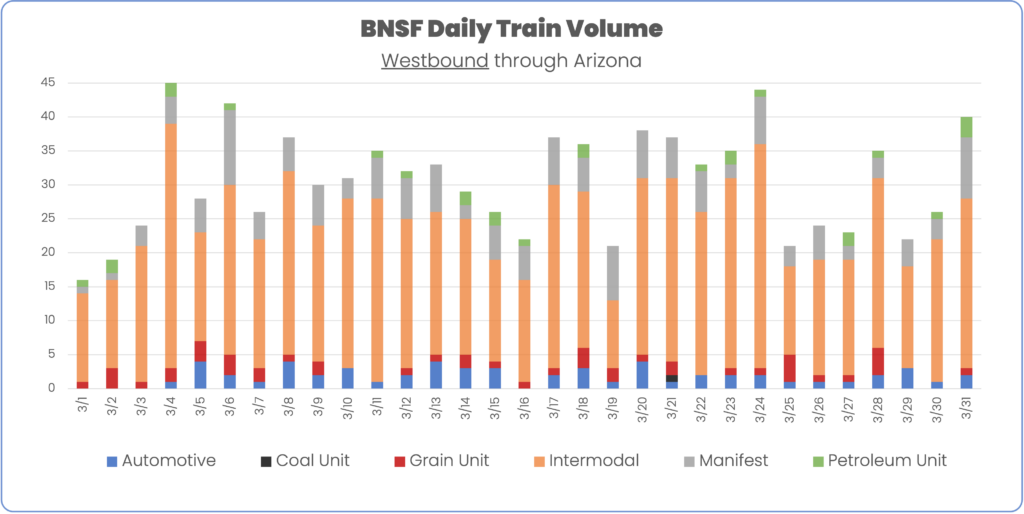
In March, BNSF moved slightly more trains per day westbound compared to the eastbound direction (30.5 WB v. 30.4 EB). Intermodal makes up a slightly smaller percentage of trains moving westbound on BNSF, 70.0% compared to 76.5% in the eastbound direction.
Union Pacific
Union Pacific moved 89,823 containers eastbound through southern California in March, evenly split between international and domestic containers. Container volume on UP has grown consistently month-over-month in early 2024. Daily container volume was 2,405 containers per day in January, 2,789 in February, and 2,898 in March. The increase in container volumes has been driven by surging imports to western ports, which is also affecting the Port of Vancouver.
Despite operating slightly fewer trains per day in March (8.1 compared to 8.24 in February), each train held approximately 20 more containers per train during the month.
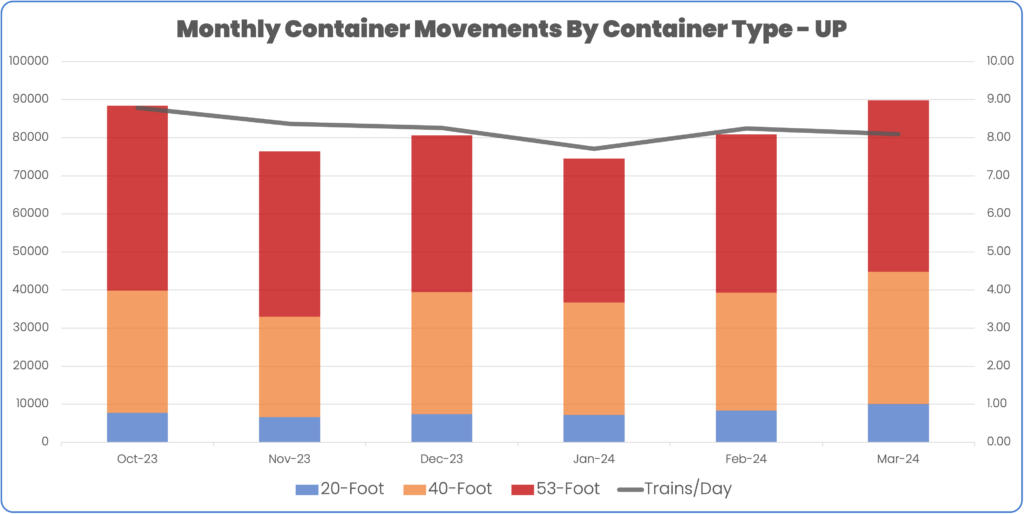
The consistent growth in container volumes to start the year has coincided with significant day-to-day variability. There have been days with fewer than 1,000 containers moving eastbound and days with close to 4,000 containers.

Other Train Movements
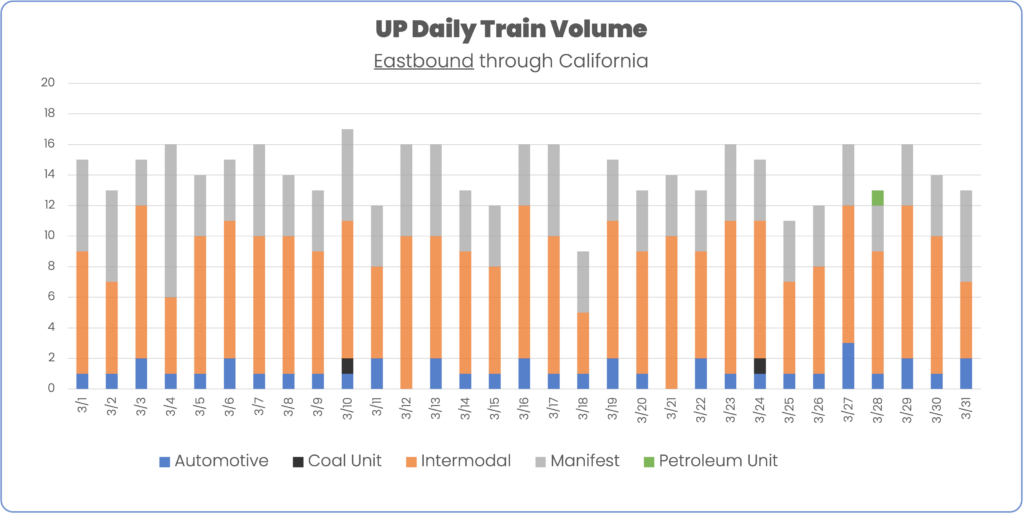
In March, daily train volume on Union Pacific eastbound through southern California averaged 14.2 trains per day, up slightly from 14.0 trains per day in February. Intermodal accounted for 58.6% of train volume in March, and 33.1% were manifest trains.
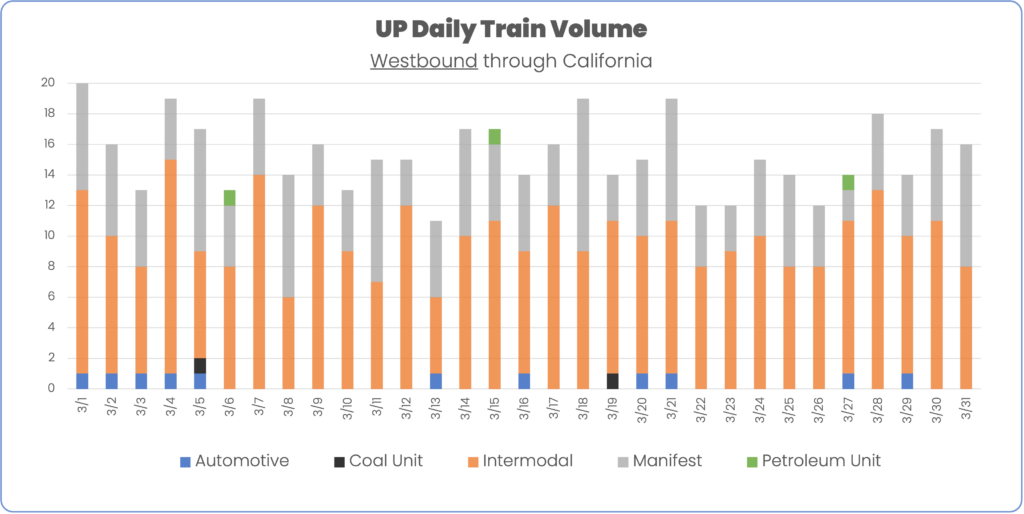
Train volumes heading westbound on UP were greater than the eastbound volumes, averaging 15.4 trains per day. An increase of more than a train per day than February (14.1 trains per day westbound). Intermodal accounted for 62% of trains and manifest represented 35%.
For additional information about this report or to receive other updates from RailState, please reach out to contact@railstate.com or subscribe to our blog.
