Cross-Border Rail Volumes – March 5, 2025
37 Comments
Comments are closed.
RailState, the industry’s only provider of rail network intelligence independently monitors cross-border train movements in real-time.
Tariffs on goods from Canada and Mexico went into effect on March 4, and we’re monitoring the impact to rail volumes as they happen.
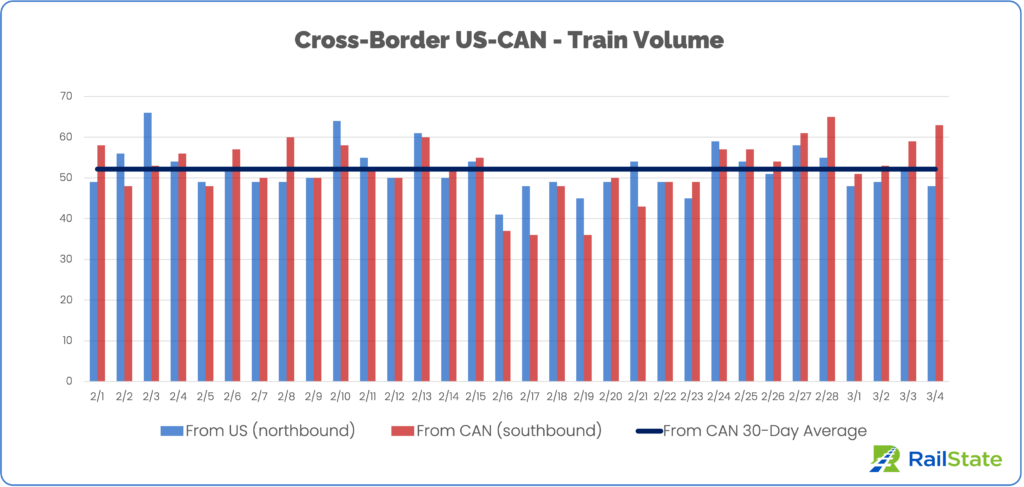
Train volumes from Canada increased as the planned tariff date got closer and yesterday we saw some of the highest southbound train volumes in the past month.
There has been consistently more southbound volume from Canada into the US in recent days. Southbound train volumes compared to the 30-day average:
The volume of railcars moving across the border from Canada has grown even more than train volumes. This is true across most commodity types, with the most recent 7-day average volumes up 17-31% above their 30-day average.
Northbound train volumes from the US, on the other hand, have been slightly lower than the 30-day average.
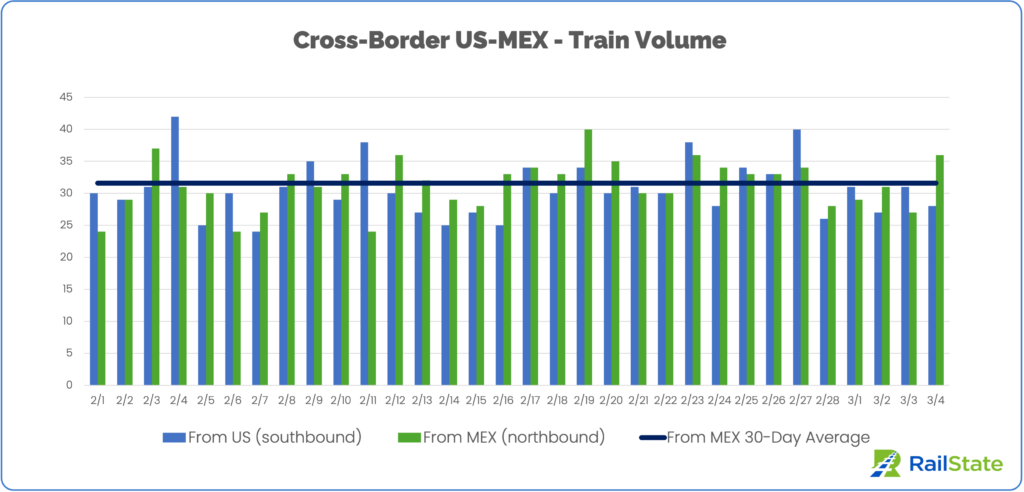
Train volumes from Mexico into the US have also grown in recent days. Northbound train volumes compared to the 30-day average:
Railcar volumes have also outpaced overall train volume changes across a number of commodity types.
Aside from grain movements, most railcar volumes have increased significantly over the past week compared to the 30-day average.
(Centerbeam flatcars account for minimal traffic across the southern border).
Southbound train volumes from the US, however, have fallen slightly in recent days. Compared to the 30-day average:
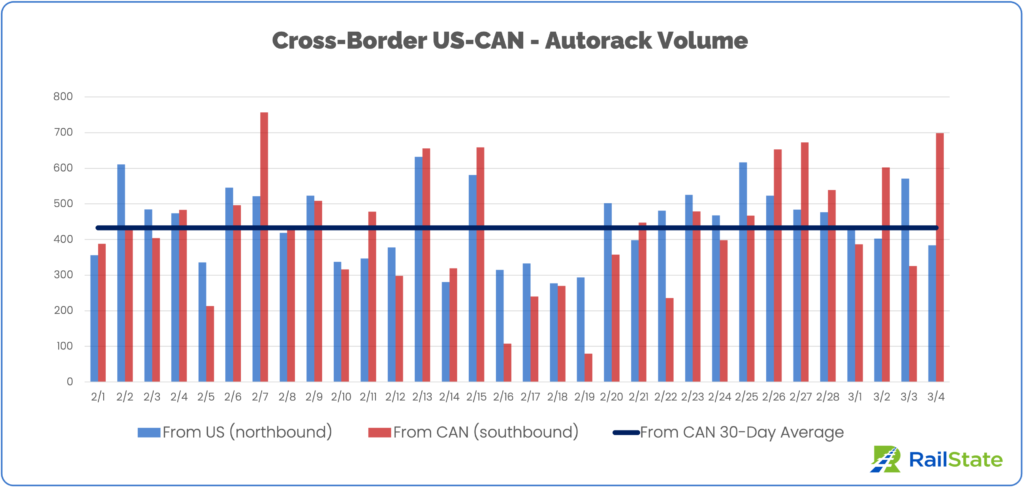
Autos have more cross-border complexity than other goods, with considerable movements of parts back and forth across the border and more original sources of materials that can differ down to the car model level.
A last minute reprieve pushed the tariffs on autos out one month, but recent southbound volumes from Canada show increased urgency to move more product in advance of the tariffs.
Compared to the 30-day southbound average:
Northbound volumes from the US have not had a reciprocal trend. Compared to the 30-day northbound average:
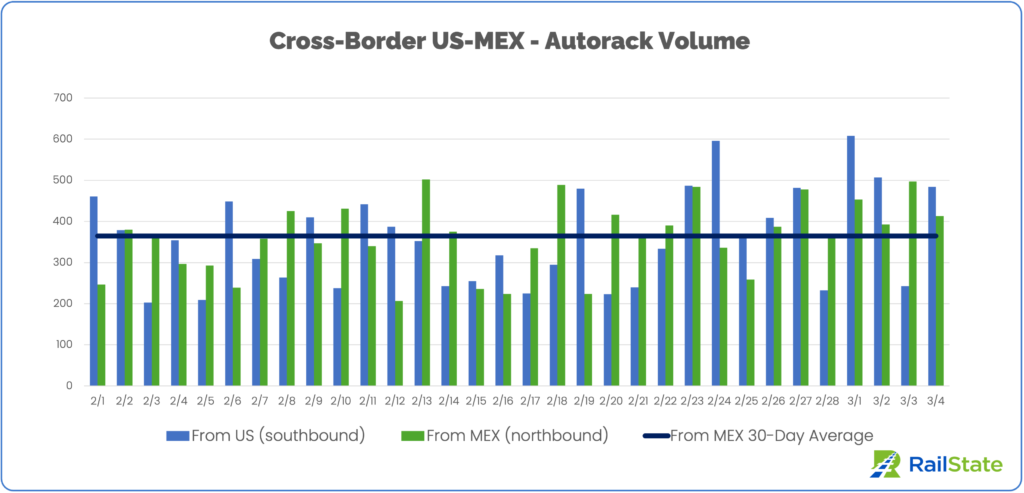
Unlike the northern border, autorack volumes across the southern border are significantly up in both directions. For movements from Mexico into the US, compared to the 30-day northbound average:
Southbound volumes from the US into Mexico have surprisingly grown even more, with volumes well above the 30-day average:
We’ll continue regular reporting on cross-border impacts from tariffs as they happen.
For additional information about this report or to receive other updates from RailState, please reach out to contact@railstate.com or subscribe to our blog.
Comments are closed.
Schedule your in-depth demo today to explore how Rail Network Intelligence can unlock insights for your rail supply chain.
Take the uncertainty out of rail with the only independent source of data on train volumes, commodity flows, corridor performance, system bottlenecks, train lengths, and more.
Copyright © 2026 RailState LLC and RailState Services LTD
finasteride proscar
finasteride proscar
vardenafil
vardenafil
finasteride hair loss
finasteride hair loss
dutasteride 0.5 mg for women
dutasteride 0.5 mg for women
prevacid otc 30mg
prevacid otc 30mg
zoloft 50 mg tablet
zoloft 50 mg tablet
avanafil tablets 100mg price
avanafil tablets 100mg price
lasix for dogs 12.5 mg
lasix for dogs 12.5 mg
lasix medicine for cats
lasix medicine for cats
fluconazole 100 mg tablet
fluconazole 100 mg tablet
furosemide 40 mg price
furosemide 40 mg price
lasix 40 mg
lasix 40 mg
clozapin
clozapin
cialis 20mg photo
cialis 20mg photo
uses of tadalafil
uses of tadalafil
sildenafil invention
sildenafil invention
xenical precio
xenical precio
creon sibo reddit
creon sibo reddit
avanafil user reviews
avanafil user reviews
xenical alli (orlistat)
xenical alli (orlistat)
rogaine canada reddit
rogaine canada reddit
doxycycline hyclate uses in hindi
doxycycline hyclate uses in hindi
does metronidazole cause weakness
does metronidazole cause weakness
metronidazole side effects bloody stool
metronidazole side effects bloody stool
minoxidil liquid costco
minoxidil liquid costco
acyclovir for cold sores
acyclovir for cold sores
who invented orlistat
who invented orlistat
ketoconazole summary
ketoconazole summary
terbinafine dosage breakdown
terbinafine dosage breakdown
toradol for joint pain
toradol for joint pain
toradol short term use guide
toradol short term use guide
ivermectin rosacea mechanism
ivermectin rosacea mechanism
minoxidil full information
minoxidil full information
minoxidil guidance faq
minoxidil guidance faq
minoxidil mechanism review
minoxidil mechanism review
minoxidil onset and peak
minoxidil onset and peak
minoxidil for women
minoxidil for women