Traffic Report: Cross Border, August 2023
RailState independently tracks all freight rail movements across Canada in real-time, including traffic flows through US/Canada border crossings.
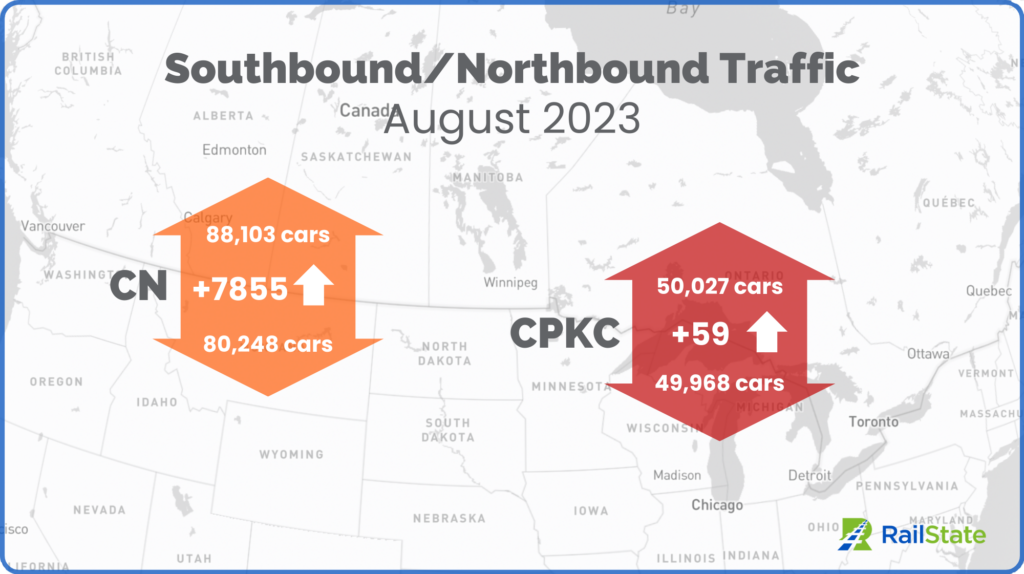
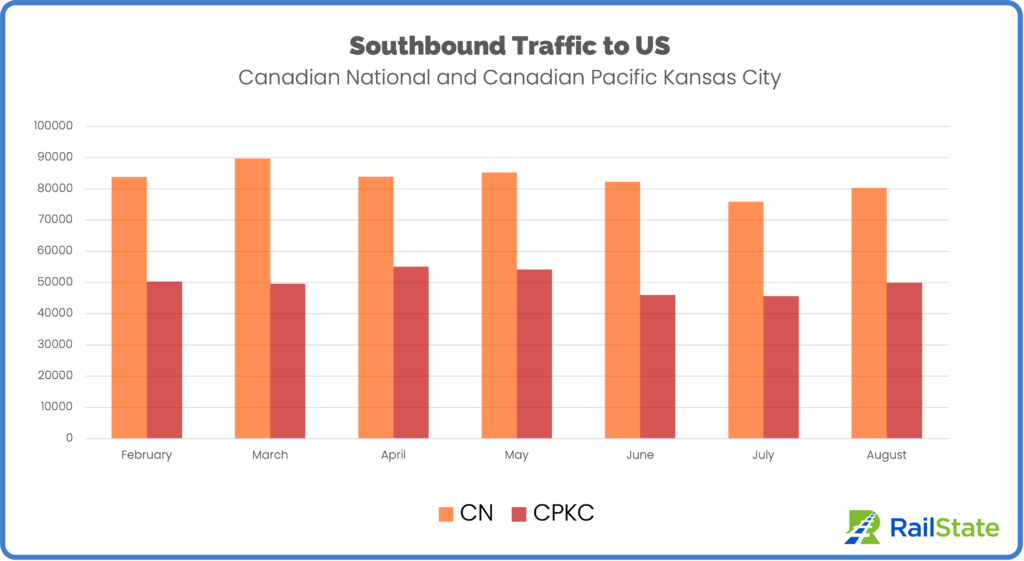
Total southbound traffic from Canada in August was 130,216 carloads. This is a 7.1% increase over July. Southbound market share is:
CN | CPKC | |
February | 62.5% | 37.5% |
March | 64.4% | 35.6% |
April | 60.4% | 39.6% |
May | 61.2% | 38.8% |
June | 64.1% | 35.9% |
July | 62.4% | 37.6% |
August | 61.6% | 38.4% |
Period average | 62.4% | 37.6% |
Both CN and CPKC increased southbound traffic in August, with CN growing 5.8% compared to July and CPKC up 9.4%.
Northbound traffic into Canada outpaced southbound traffic in August, with the majority of the difference coming on CN. CPKC showed a near identical balance of flows, with only a 59-carload difference for the month.
The busiest border crossings for CN traffic were Port Huron, MI (42.1% of total CN southbound traffic), Fort Frances, ON/International Falls, MN (34.4%), and Blaine, WA/Vancouver-Seattle (via BNSF) (23.5%).
For CPKC, the busiest crossings were Windsor (31.3% of total CP southbound traffic), North Portal, SK (27.8%), Emerson, MB (14.4%), and Kingsgate, BC (11.9%).
CPKC is heavily weighted toward chemicals and agricultural products. Tanks cars and covered hoppers account for 61.9% of total southbound traffic.
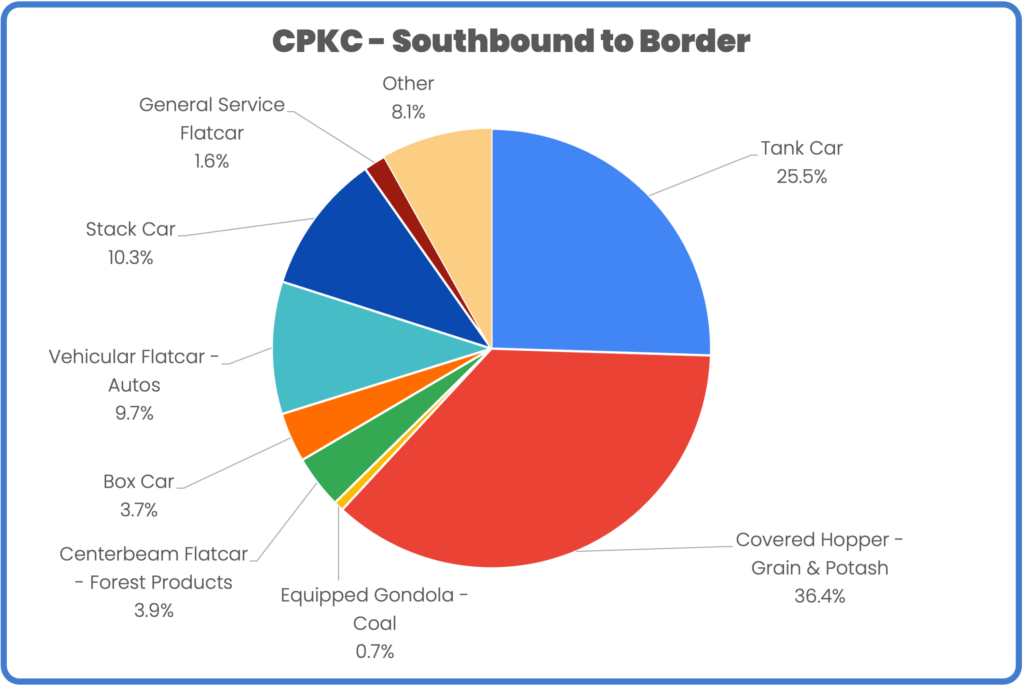
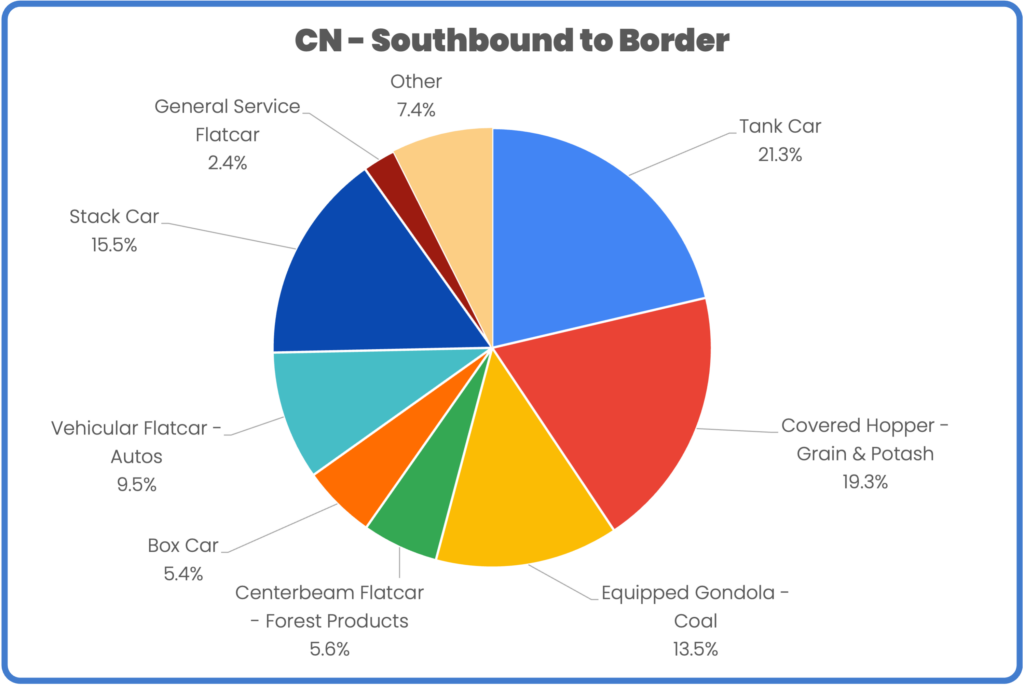
CN moves more coal cars southbound than CPKC. Equipped gondolas account for 13.5% of total southbound traffic. The biggest difference among the carriers is in agricultural cars, with CPKC carrying nearly twice the proportion of covered hoppers than CN (36.4% compared to 19.3%). CN moved a larger proportion of stack cars than CPKC in August (15.5% compared to 10.3%).
Schedule your in-depth demo today to explore how Rail Network Intelligence can unlock insights for your rail supply chain.
Take the uncertainty out of rail with the only independent source of data on train volumes, commodity flows, corridor performance, system bottlenecks, train lengths, and more.
Copyright © 2026 RailState LLC and RailState Services LTD