Intermodal Traffic Report: Import Traffic Through Vancouver Declined 3% in Early April
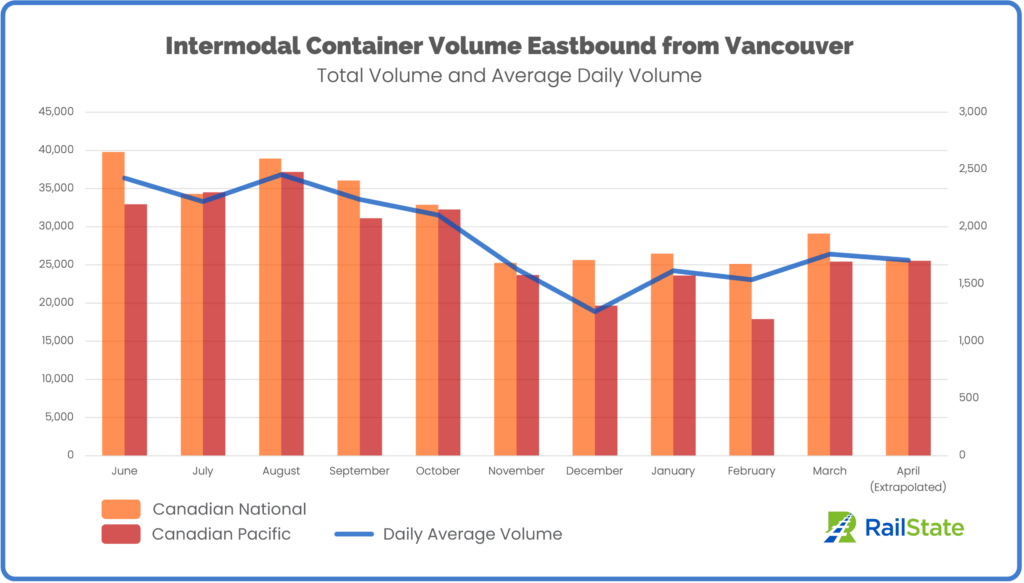
RailState independently tracks all freight rail movements across Canada. A review of eastbound trains originating in Vancouver in the first half of April showed a decrease in intermodal traffic compared to the previous month, and a continuation of low intermodal volume over the previous six months.
For the period April 1-15, 25,607 intermodal containers originated in Vancouver, resulting in a daily average volume of 1,707 containers per day. This represents a 3% reduction in the daily average volume from March.
Without significant changes in volume in the second half of this month, April intermodal volume will come in below March’s totals and continue the trend of 2023 intermodal volume lagging well behind the previous year.
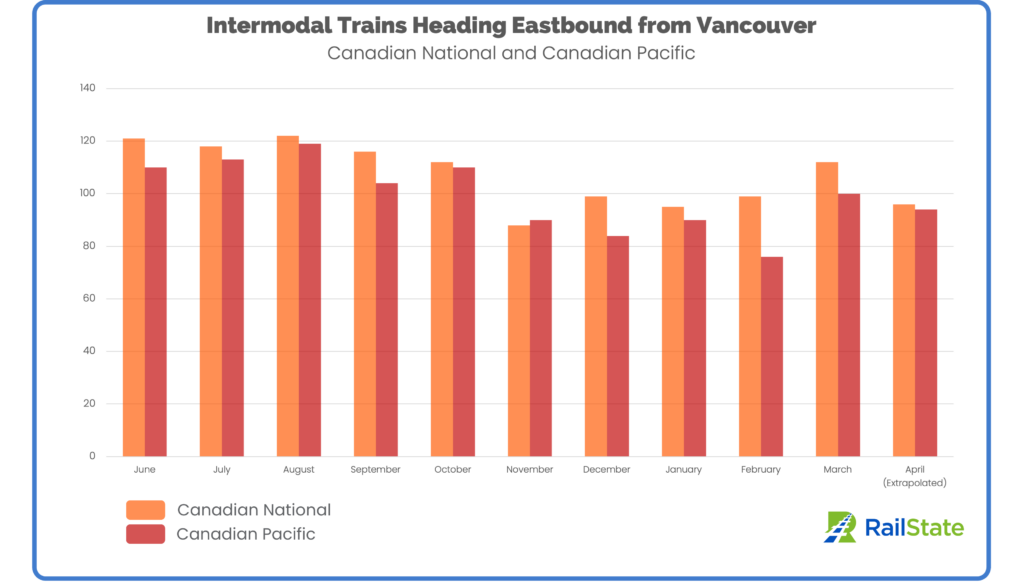
For much of the past year, CN and CP ran similar numbers of intermodal trains out of Vancouver. Recent months have shown more variation. In early April, CN ran about 4 fewer trains per week than in March. CP ran 1.5 fewer trains per week in April compared to March.
The container size mix also differs between the two railways. The majority of containers in this lane on CN trains (63%) are 40’, 21% are 20’ containers, and 16% are 53’ containers. CP’s container mix also has a majority (61%) of 40’ containers, 20’ containers account for 16%, and 53’ containers account for a larger percentage (23%).
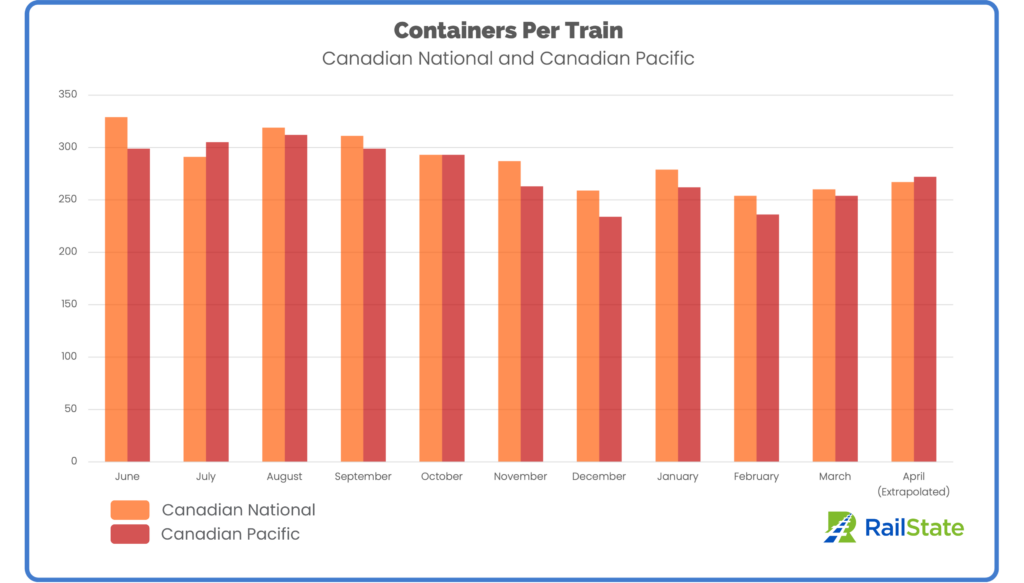
Currently, CN and CP are running about 13% below their peak volume of the past year in terms of containers per train.
Schedule your in-depth demo today to explore how Rail Network Intelligence can unlock insights for your rail supply chain.
Take the uncertainty out of rail with the only independent source of data on train volumes, commodity flows, corridor performance, system bottlenecks, train lengths, and more.
Copyright © 2026 RailState LLC and RailState Services LTD