Canada Intermodal Rail Volume Report: August 2024
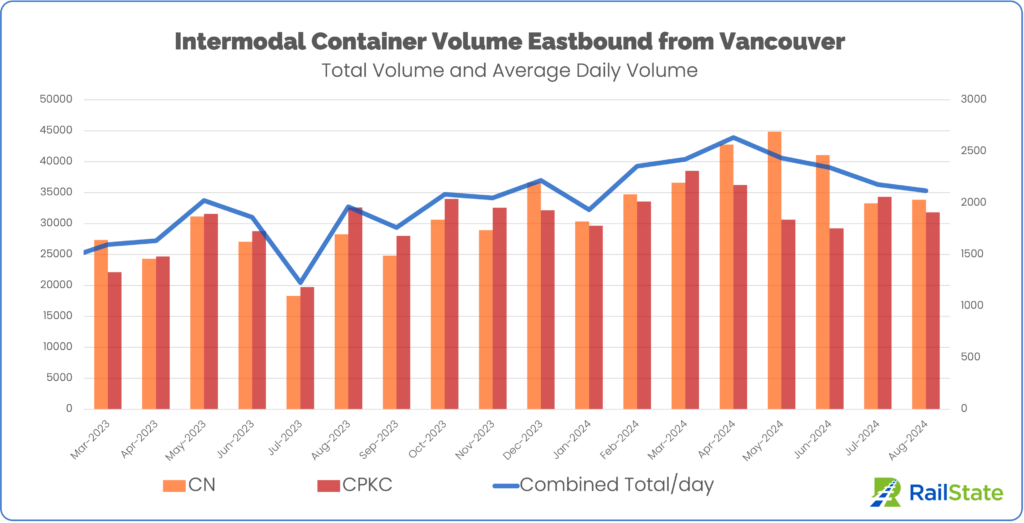
Lockout Keeps Container Volume Down
Intermodal movements fell, as did all train movements due to the work stoppage and system-wide shutdown toward the end of August. CN’s operations stopped for more than a full day and service did not return on CPKC for four days. Soon after the return to service, intermodal volumes hit their pre-lockout averages.
Combined container volume through the Port of Vancouver was 65,632. This total is down 2.8% from July yet 7.8% higher than August 2023. CN container volumes through Vancouver were up 1.8% from July, when CN experienced a multi-day stoppage on its main line due to the Jasper Fire. August 2024 totals were 19.7% higher than a year ago.
CPKC’s total container volume was down 7.3% from July and down 2.5% from August 2023.
Port of Vancouver
Current Status
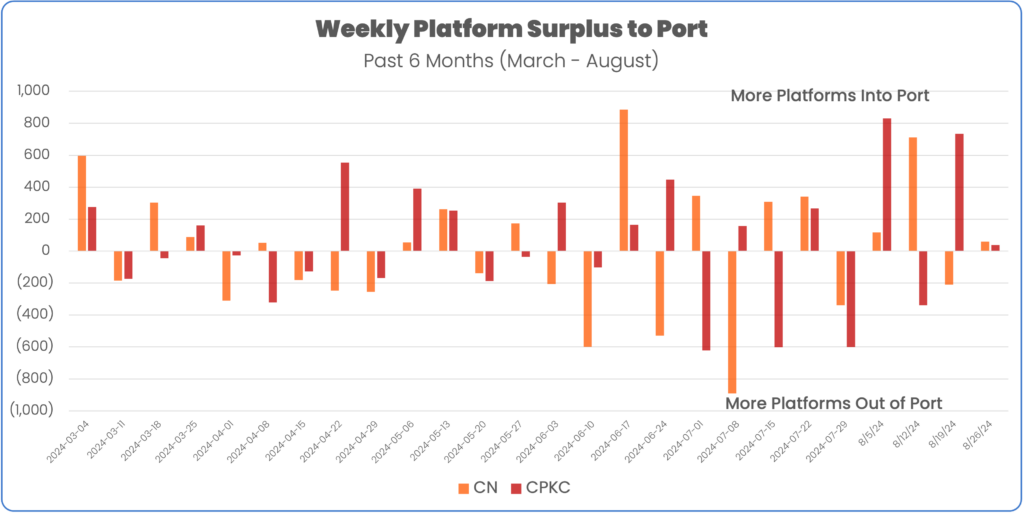
On-dock footage rose for both railroads in August and have started to decrease post-lockout, according to the Port of Vancouver’s September 5 update.
Both railroads moved more platforms into the port region leading up to the work stoppage.
Recent Surplus of Westbound Platforms v. Eastbound | ||
Week | CN | CPKC |
8/26/24 – 9/1/24 | 58 | 37 |
8/19/24 – 8/25/24 | (211) | 733 |
8/12/24 – 8/18/24 | 712 | (340) |
8/5/24 – 8/11/24 | 116 | 831 |
7/29/24 – 8/4/24 | (339) | (601) |
6-month weekly average | 2 | 32 |
Total Train Volumes
Total intermodal train volume out of the Port of Vancouver was in line with July volumes, with just 2 fewer trains total for the month. This total was 12 fewer trains (-5.4%) compared to August 2023.

Canadian National
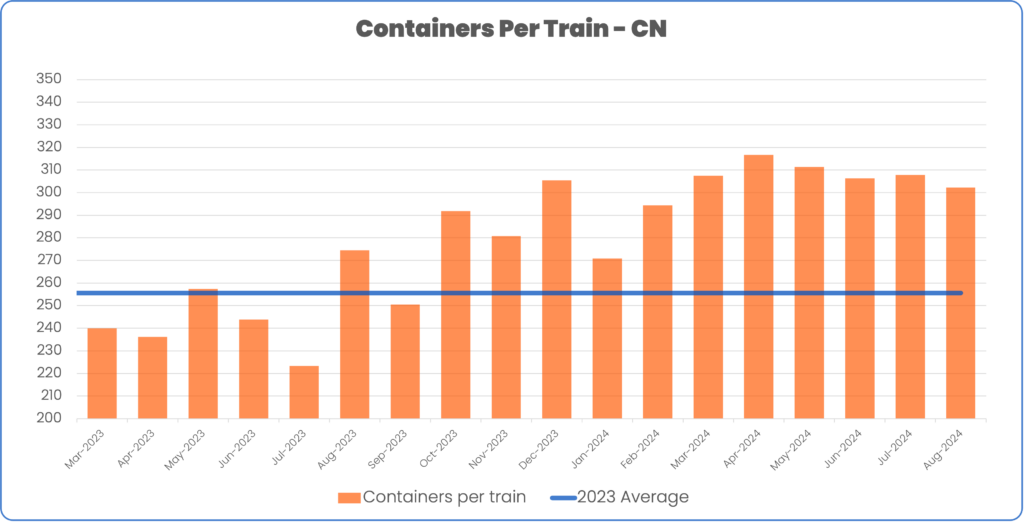
CN moved an average of 3.61 trains per day in August, up 3.7% from July. Train volume was up 8.7% from a year ago. Compared to the highest volume months this year (April – June), CN moved 1 fewer train per day in August.
Average train size fell slightly from the prior month, with 5 fewer platforms per train, and 5 fewer containers per train. Compared to a year ago, CN trains carried 10.1% more containers per train.
Canadian Pacific – Kansas City
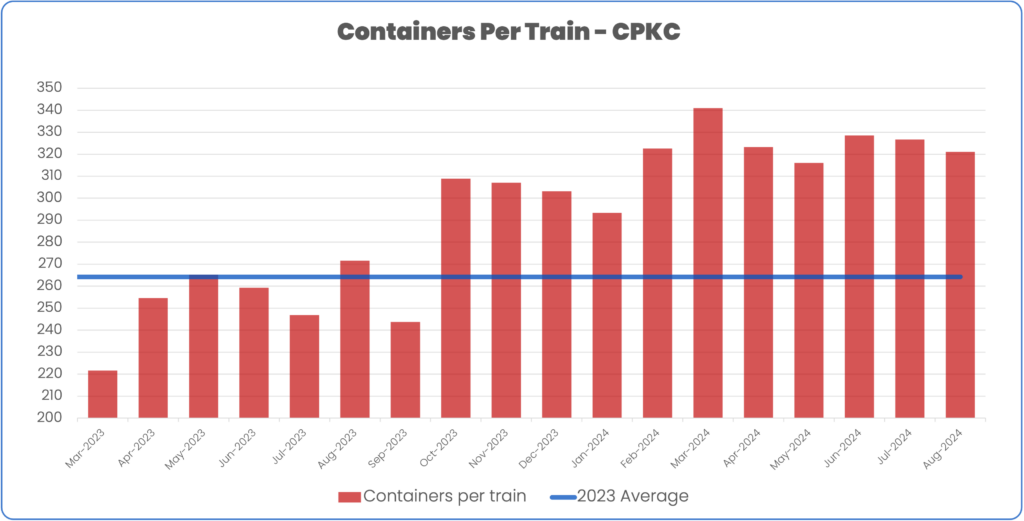
CPKC daily train volume in August was 15.7% lower than in July, and down 17.5% from August 2023. Average train size was slightly smaller in August, with 4 fewer platforms and 5 fewer containers per train.
Prince Rupert
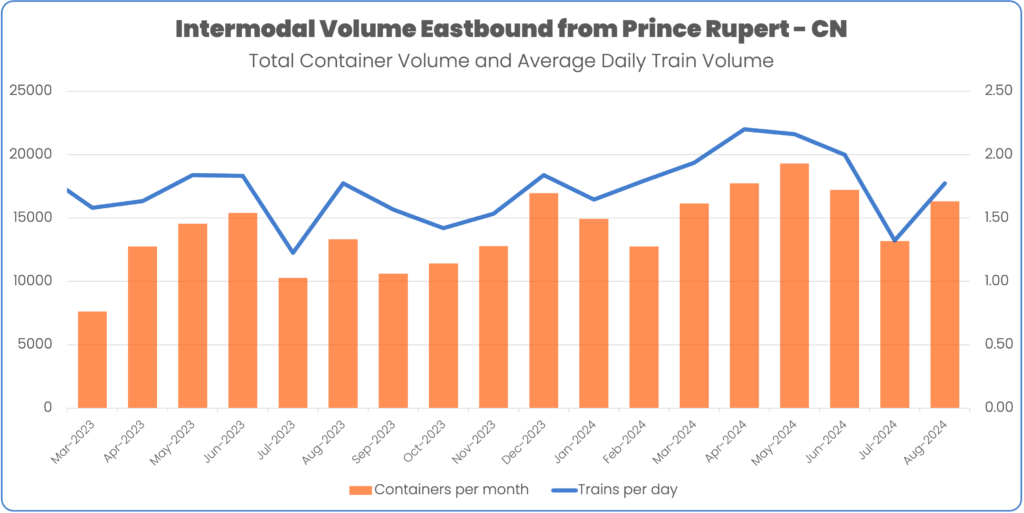
Container volume through Prince Rupert increased in August, despite the lockout. Prince Rupert saw 16,308 containers, up 23.7% from July. Compared to a year ago, container volume was up 22.4%.
The increase in containers over last year came from more containers per train, 296.5 per train in August 2024 compared to 242.2 in August 2023. Last month and a year ago, the same number of trains were run.
For additional information about this report or to receive other updates from RailState, please reach out to contact@railstate.com or subscribe to our blog.
