Canada Intermodal Rail Volume Report: April 2024
CN Boosts Train Volumes Out of Western Ports
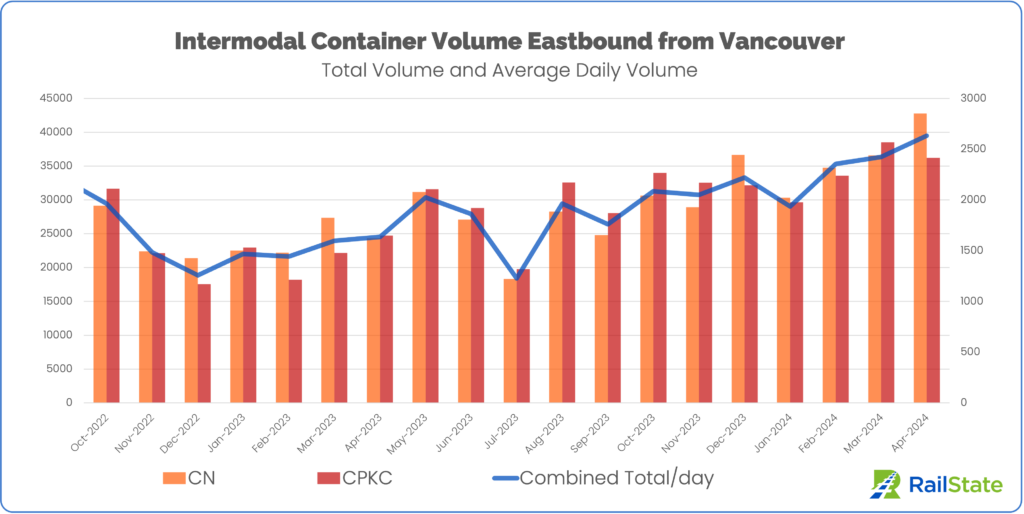
Container volume in April hit the highest totals RailState has ever recorded. A combined 96,719 containers moved eastbound out of the western Canada ports. This is 6% higher than March and 56.5% above April 2023.
The growth has all come from CN, which ran 16 additional trains out of Vancouver for a 16.9% increase in total container volume. CN also added 6 trains from Prince Rupert leading to a 10% growth in container volume.
The increased volumes on CN still have not been enough to significantly change the situation at the Port of Vancouver.
Port of Vancouver
Current Status
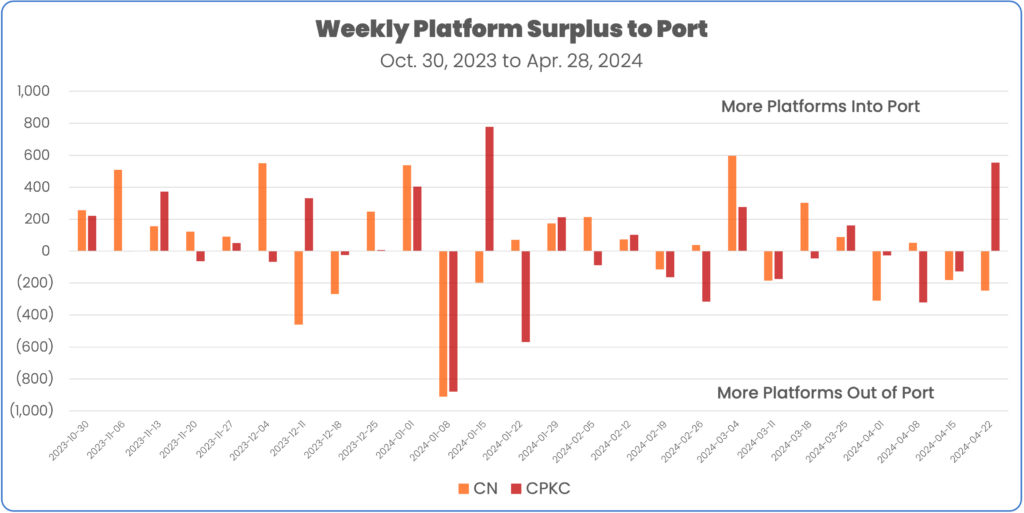
CN’s on-dock footage has steadily increased throughout the month and remains high at Deltaport. At Vanterm, CN’s footage has doubled since the middle of April according to the Port of Vancouver’s May 1 update. CN has consistently moved more platforms westbound into the port but it has not been enough to clear the container growth.
CPKC, on the other hand, has steadily reduced their on-dock footage at Vancouver. CPKC has moved significantly more platforms eastbound out of the port, which has helped reduce their on-dock footage. In the past week they moved a surplus of platforms into the port and likely have the capacity to keep on-dock totals low.
Recent Surplus of Westbound Platforms v. Eastbound | ||
Week | CN | CPKC |
4/22/24 – 4/28/24 | (247) | 554 |
4/15/24 – 4/21/24 | (181) | (126) |
4/08/24 – 4/14/24 | 52 | (321) |
4/01/24 – 4/07/24 | (310) | (26) |
3/25/24 – 3/31/24 | 88 | 161 |
3/18/24 – 3/24/24 | 303 | (45) |
6-month weekly average | 46 | 23 |
Train Volumes Increase
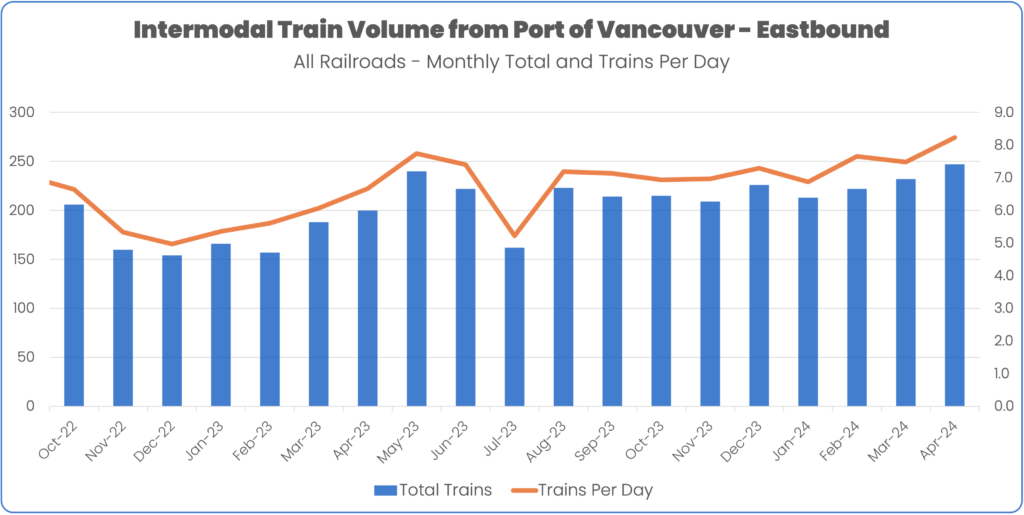
Total intermodal train volume grew 6.5% in March, driven entirely by the increases from CN.
Canadian National
CN moved an average of 4.50 trains per day, the highest daily average RailState has recorded. It’s a 17.2% increase over March and a 31.1% increase from a year ago.
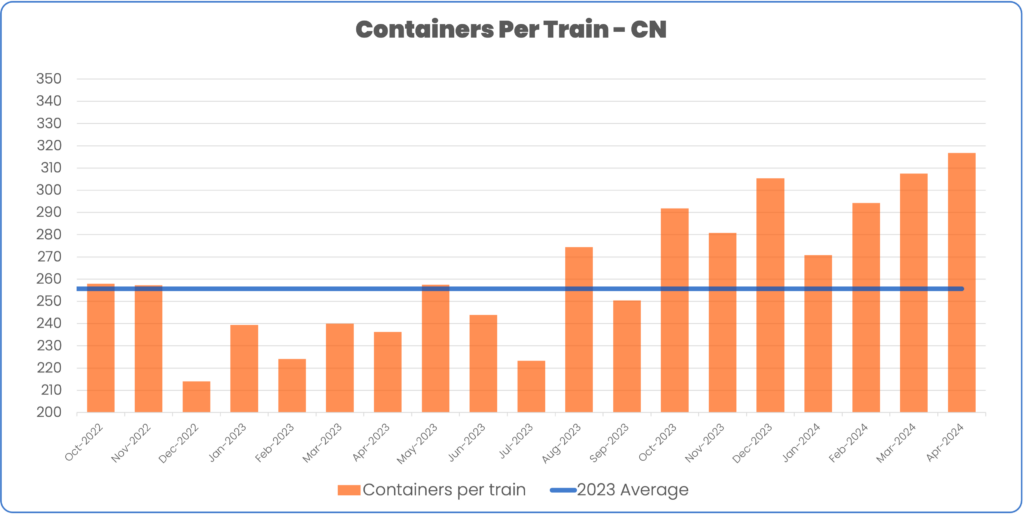
CN also increased the number of containers per train, averaging 317 containers per train, a 76% increase over last year.
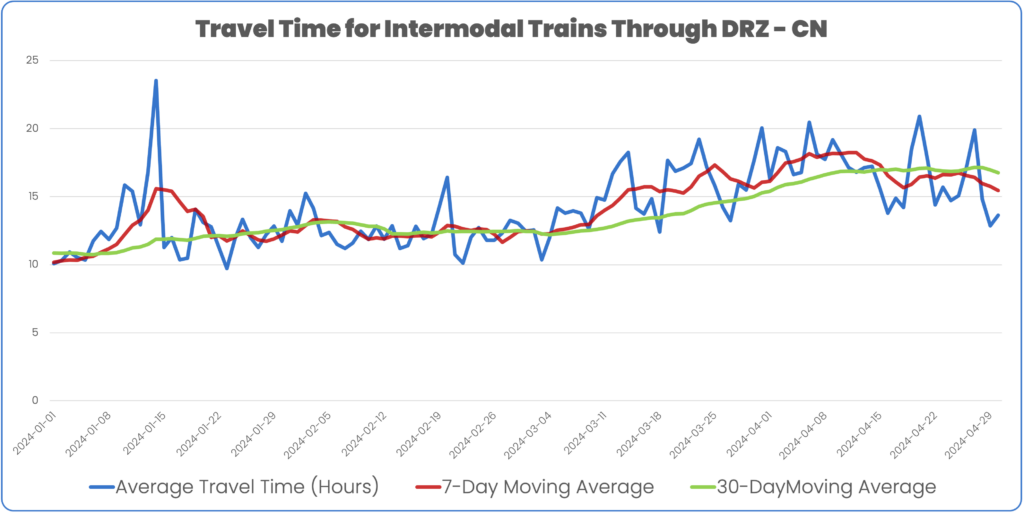
Travel times on CN are still higher than earlier in the year but have started to improve slightly. RailState’s network measures the 220-mile journey from Mission City, BC to Heffley, BC. The seven-day moving average hit 15.5 hours at the end of April, down from 17.3 hours in the middle of the month.
Canadian Pacific – Kansas City
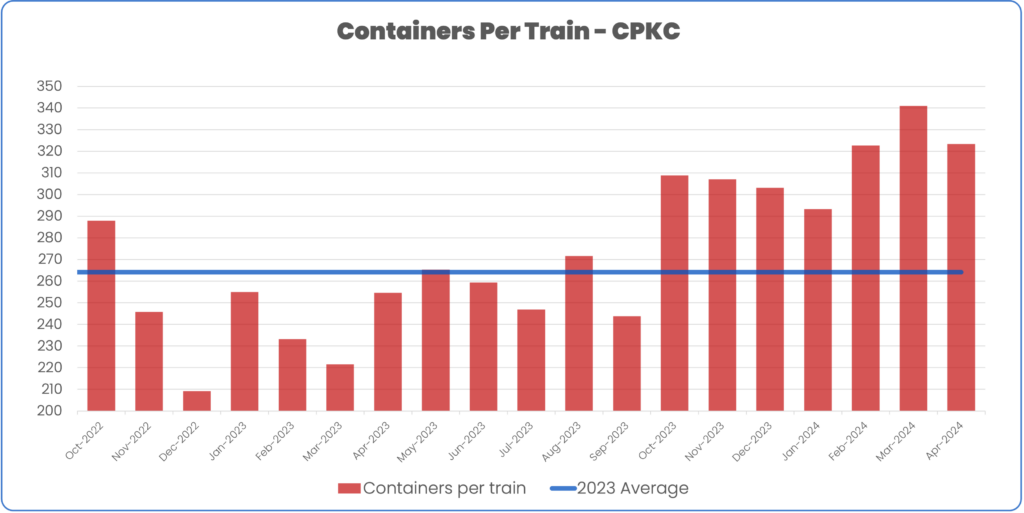
CPKC train volume remained steady in April but overall container volume eased a bit, with smaller trains – holding an average of 5% fewer containers per train.
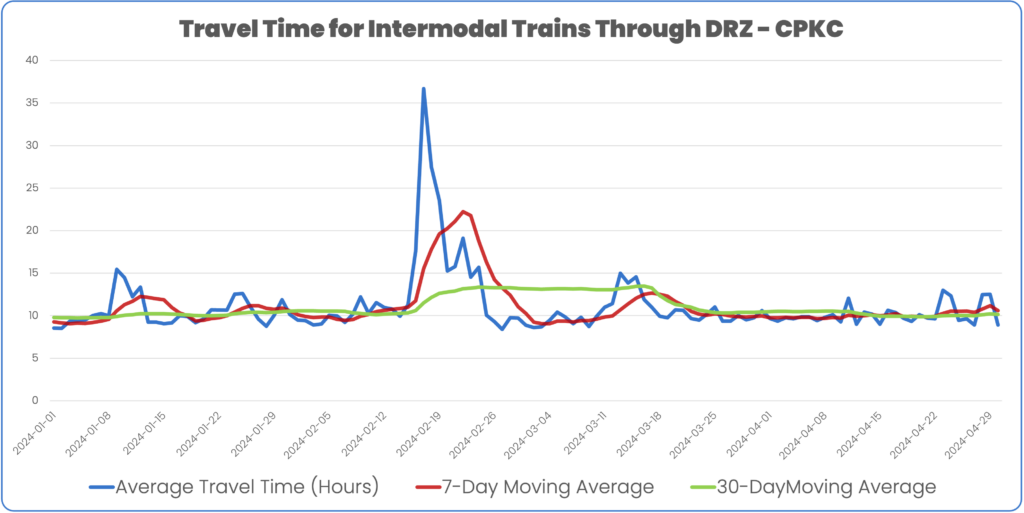
Travel times on CPKC have been mostly consistent on the 243-mile journey from Mission City, BC to Chase, BC. CPKC intermodal trains have consistently completed this stretch in about 10 hours. Despite a marginal, temporary uptick towards the end of the month, travel times have averaged about 10 hours through the directional running zone.
CPKC has been a model of consistency in other areas as well. CPKC’s share of containers headed to the United States has remained steady at around 25% over the past six months.
Prince Rupert
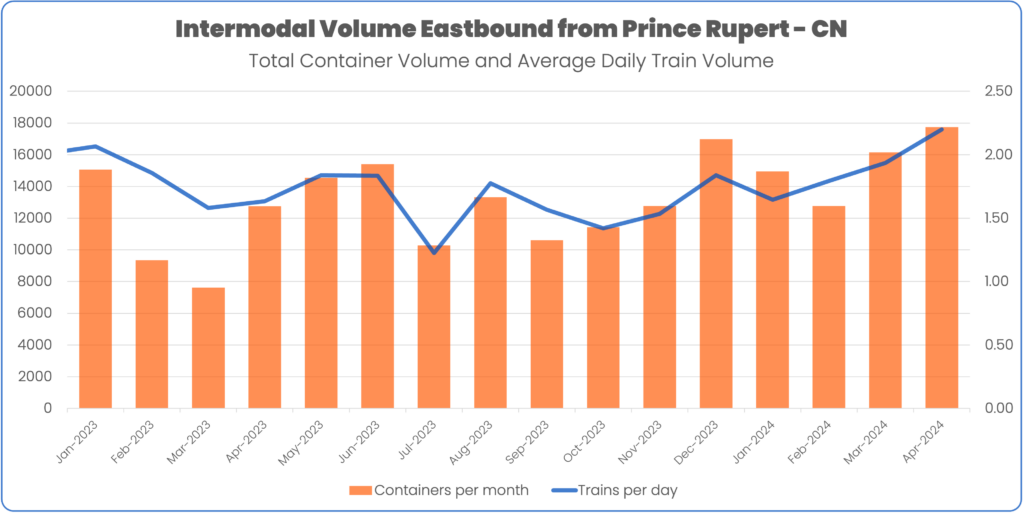
Intermodal performance through Prince Rupert also hit the highest levels RailState has recorded. Total container volume was 17,748, an increase of 10% over March and 39% higher than the previous year.
Containers per train remained unchanged from March and train volume rose 10%.
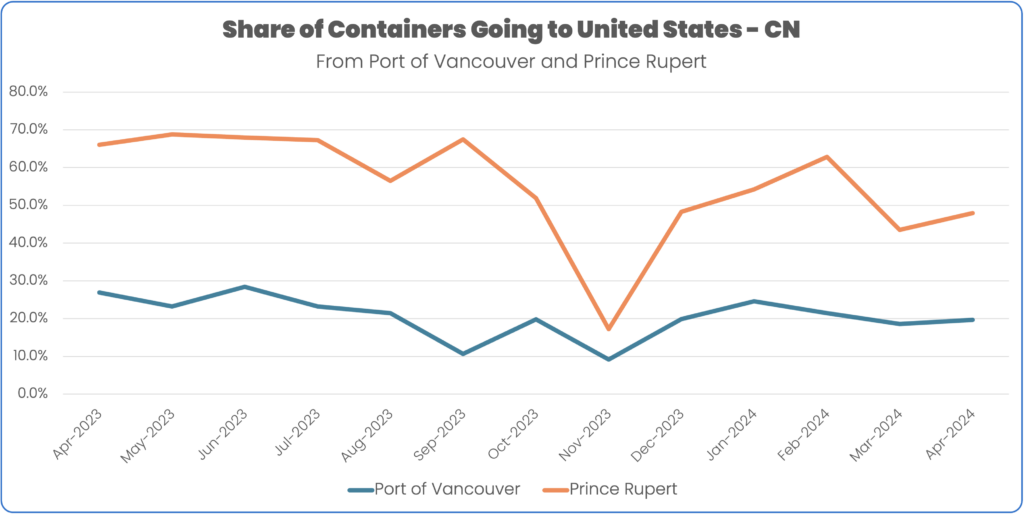
In addition to movements out of the port regions, RailState also tracks containers as they move to their final destination, including across the US-Canada border. The share of container volume headed to the U.S. out of Prince Rupert increased in April to 48% from 43.5% in March. Container volume from the Port of Vancouver into the US saw a marginal increase, 19.7% compared to 18.6% a month earlier.
For additional information about this report or to receive other updates from RailState, please reach out to contact@railstate.com or subscribe to our blog.
