Winter Storm Fern: RailState Data Shows Network Impact Across Three States
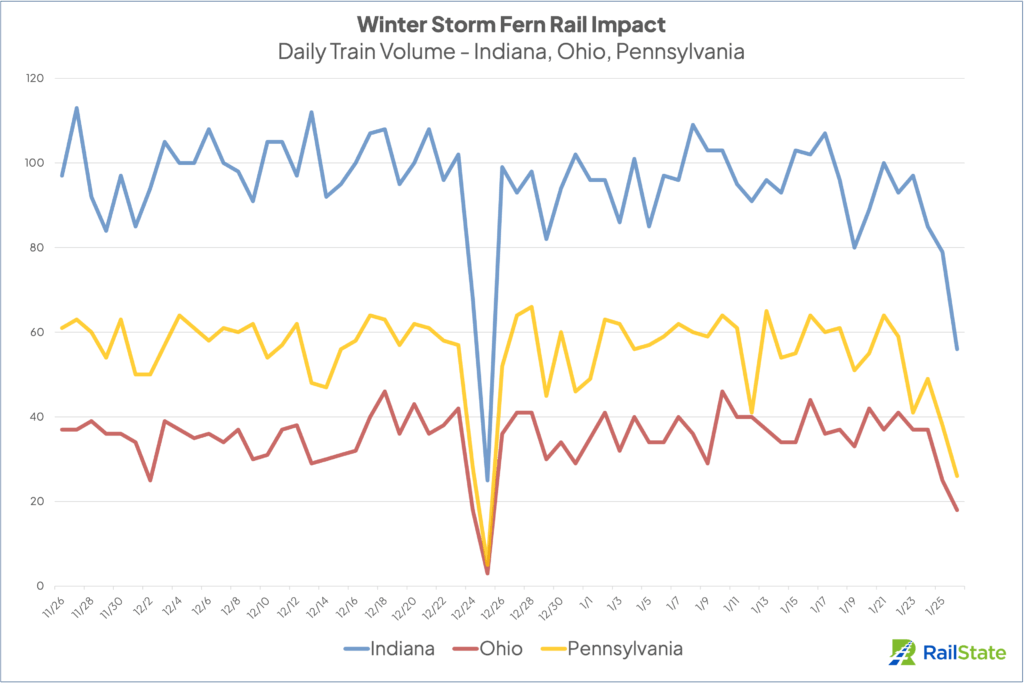
When Winter Storm Fern tore through most of the eastern half of the country, freight trains kept moving, but not at the same rate everywhere. RailState’s sensors across Ohio, Pennsylvania, and Indiana show markedly different patterns in train volumes and lengths on the network we monitor.
Only RailState captures this near real-time, state-by-state operational detail. No public source tracks how train volumes and lengths actually change during major weather events.
Ohio: Steep Declines in Both Volume and Train Length
On RailState’s Ohio network, the storm produced the sharpest adjustments.
In the baseline period (November 26, 2025 through January 23, 2026), RailState observed 35.2 trains per day across sensor locations on Norfolk Southern. During the storm window (January 24–26), that fell to 27.3 trains per day—a 22.5% drop.
Train lengths on RailState’s Ohio network also fell sharply. The median train shrank from 6,473 feet to 5,580 feet—a 13.8% reduction, the steepest length change across all three states RailState monitors.
By direction on RailState’s Ohio sites:
- Eastbound median: 6,225 → 5,663 feet (–9.0%)
- Westbound median: 6,929 → 5,497 feet (–20.7%)
Westbound trains on RailState’s Ohio network became more than a fifth shorter during the storm.
Among major train types on RailState’s Ohio sites:
- Intermodal median: 7,098 → 5,619 feet (–20.8%)
- Manifest median: 6,637 → 5,327 feet (–19.7%)
On the Ohio network RailState monitors, both volume and length declined significantly, with westbound and time-sensitive freight types showing the largest shifts.
Pennsylvania: Larger Volume Drop, Moderate Length Changes
On RailState’s Pennsylvania network, train volumes fell more sharply than in Ohio, but train lengths held closer to baseline.
Baseline average on RailState’s Pennsylvania sites: 50.5 trains per day. Storm window average: 36.7 trains per day (–27.4%).
Median train length on RailState’s Pennsylvania network: 5,965 → 5,670 feet (–5.0%).
The directional split on RailState’s Pennsylvania sites shows different patterns:
- Eastbound median: 5,930 → 5,308 feet (–10.5%)
- Westbound median: 5,988 → 6,116 feet (+2.1%)
Eastbound trains on RailState’s Pennsylvania network got noticeably shorter. Westbound trains on those same sites actually lengthened slightly.
Among major train types on RailState’s Pennsylvania sites:
- Intermodal median: 6,040 → 5,414 feet (–10.4%)
- Manifest median: 6,136 → 5,670 feet (–7.6%)
On the Pennsylvania network RailState observes, volumes contracted more than in Ohio, but the trains that ran maintained most of their typical configurations.
Indiana: Minimal Length Changes Despite Volume Drop
On RailState’s Indiana network, the busiest of the three states by train count, train volumes declined but lengths barely shifted. RailState’s network currently covers NS’s Chicago Line subdivision and CSX’s Garrett subdivision.
Baseline on RailState’s Indiana sites: 95.1 trains per day. Storm window: 74.3 trains per day (–21.9%).
The remarkable finding: median train length on RailState’s Indiana network changed only 1.6% (from 6,327 to 6,228 feet)—a statistical rounding error compared to the changes observed in Ohio and Pennsylvania.
Directional patterns on RailState’s Indiana sites differ from the other two states:
- Eastbound median: 6,212 → 5,912 feet (–4.8%)
- Westbound median: 6,513 → 6,991 feet (+7.3%)
Westbound trains on RailState’s Indiana network increased in size during the storm, more than 7% longer than baseline.
Train types on RailState’s Indiana sites:
- Intermodal median: 7,038 → 6,939 feet (–1.4%)
- Manifest median: 6,188 → 5,844 feet (–5.6%)
- Automotive median: 7,413 → 7,987 feet (+7.7%)
On the Indiana network RailState monitors, train volumes fell roughly a fifth, but train configurations—especially westbound and automotive—remained close to or above typical sizes.
Why this Data Matters
RailState is the only independent source capturing train-by-train operational data in real time on the network it monitors. These are direct measurements, not models, so stakeholders no longer have to speculate about how storms affect freight rail.
Weekly AAR carload reports don’t provide state-by-state breakdowns. Quarterly railroad earnings summarize systemwide trends. Government freight statistics—where available—publish weeks or months after the fact.
RailState’s sensors track every train that passes on the monitored sections: its timing, direction, length, and full train composition. During Winter Storm Fern, that meant capturing:
- How train volumes and lengths changed by state
- Which directional flows showed larger shifts
- Which train types experienced the biggest configuration changes
For shippers relying on rail, understanding how actual train traffic patterns changed during extreme weather on specific corridors is critical planning data. For logistics professionals, it answers a question no other source can: what actually happened to freight rail in Ohio, Pennsylvania, and Indiana during this storm—based on observations, not assumptions.
For state and regional planners and government agencies, this kind of measured, location-specific data supports better decisions on critical supply chains and rail safety. It provides an objective basis to assess how well key corridors continue to move freight during extreme weather, where vulnerabilities may exist, and where infrastructure or policy interventions could have the greatest impact.
Together, these findings show that Winter Storm Fern did not have a single, uniform “rail story,” even across neighboring states. Each monitored network segment experienced its own pattern of volume and length changes, and those differences only emerge when every train is measured in real time.
As RailState’s coverage expands, this same measurement-based approach can be applied to more corridors, more events, and more regions—building a factual record of how freight rail behaves under stress that shippers, carriers, and public-sector stakeholders can all rely on.
About this analysis
RailState’s current coverage includes monitoring points on major rail corridors in Ohio, Pennsylvania, and Indiana. These data represent what RailState directly observed on its deployed network—a portion of total rail traffic moving through each state, not the complete state-level picture.
Baseline period: November 26, 2025 through January 23, 2026 (59 days). Storm period: January 24–26, 2026. January 26 data covers through 5 p.m. Eastern.