
Potash Is in the Headlines. Here Is Where It Actually Goes.
A proposed U.S. deal with Belarus put potash in the news this week. Canada supplies most of what North America uses, nearly all of it moves by rail, and RailState’s trackside cameras measure the trains.
Roughly three of every four tonnes of potash spread on American farms come out of the ground in Saskatchewan, and most of it crosses the border on a train. On September 21, President Trump said the United States is working on a deal to buy potash from Belarus.
The United States is “working on a massive Deal with respect to the purchase of Potash from Belarus,” the President said in a statement, at pricing “substantially less than we are currently paying to Canada” (Reuters). Belarusian President Alexander Lukashenko confirmed a deal was under discussion but said most of his country’s potash is already committed to China, India, and Indonesia (Globe and Mail).
Whatever comes of the talks, they put a practical question in front of farmers, traders, and investors: where does North America’s potash come from, and where does it go? For potash, that question has an unusually precise answer, because nearly all of it moves by train.
Why Canada, and Why Rail
Canada is the world’s largest potash producer. Its mines produced 25.0 million tonnes in 2024, 32.8% of global output, ahead of Russia at 16.6 million and Belarus at 12.1 million (Natural Resources Canada). Every tonne of it comes from ten mines in Saskatchewan, operated by three companies: Nutrien, Mosaic, and K+S Potash Canada. Because Canadian farms use only a small share of that output, more than 90% of it is exported, and the industry is built around those export markets. The United States is by far the largest of them, taking about 12 million of the 22.8 million tonnes Canada shipped abroad in 2024 (Library of Parliament). The dependence runs both ways: the U.S. imports 92% of the potash it consumes, and 79% of those imports come from Canada (USGS). For Canada, that trade was worth C$9.0 billion in 2025 (Natural Resources Canada). The rest of the world is served through Canpotex, the joint export company through which Nutrien and Mosaic sell their offshore potash, while K+S markets its own.
Potash is also one of the most rail-dependent commodities there is. The mines sit roughly 2,000 km from tidewater and 1,000 km from the U.S. Corn Belt, and the product moves in 100-tonne hopper loads that only a railway can carry at that scale. Statistics Canada counted 23.0 million tonnes of potash loaded on Canadian railways in 2022, against 24.5 million tonnes produced that year (Statistics Canada, Natural Resources Canada), which means that nearly everything that comes out of the ground goes straight onto a train. If you can count the trains, you can see the industry.
RailState’s trackside cameras measure all of those movements. In the twelve months to August 2026, RailState observed about 252,000 loaded potash cars leaving Saskatchewan mines, roughly 25.2 million tonnes, in line with the production Natural Resources Canada reports for a full year.
Potash Railed from the Mines, by Company
Each carload is assumed to carry 100 tonnes of potash. Weeks start on Monday and are listed by their starting date. Lighter bars indicate periods still in progress.
Source: RailState sensor network.
Because potash cars carry the marks of the companies that own or lease them, RailState can tell whose potash is on each train and whether it is bound for an export terminal or a North American customer. Many cars are leased by Canpotex, the export company that sells Nutrien’s and Mosaic’s offshore potash. Using car marks combined with traffic patterns around the mines, RailState can attribute each train to the mine that loaded it: Nutrien’s operations around Saskatoon and at Rocanville loaded 59% of the cars over the two years, Mosaic’s Esterhazy, Belle Plaine, and Colonsay mines 32%, and K+S’s Bethune mine 9%.
Where It Goes
Potash railed to export terminals and across the US border, by producer
The dots show potash trains moving from the mines, at two weeks per second.
Trade statistics count potash railed to Portland and other US ports as US imports, but it is shipped on to overseas customers, so here it is shown with the export terminals. The US category covers only potash for the US domestic market.
Source: RailState sensor network.
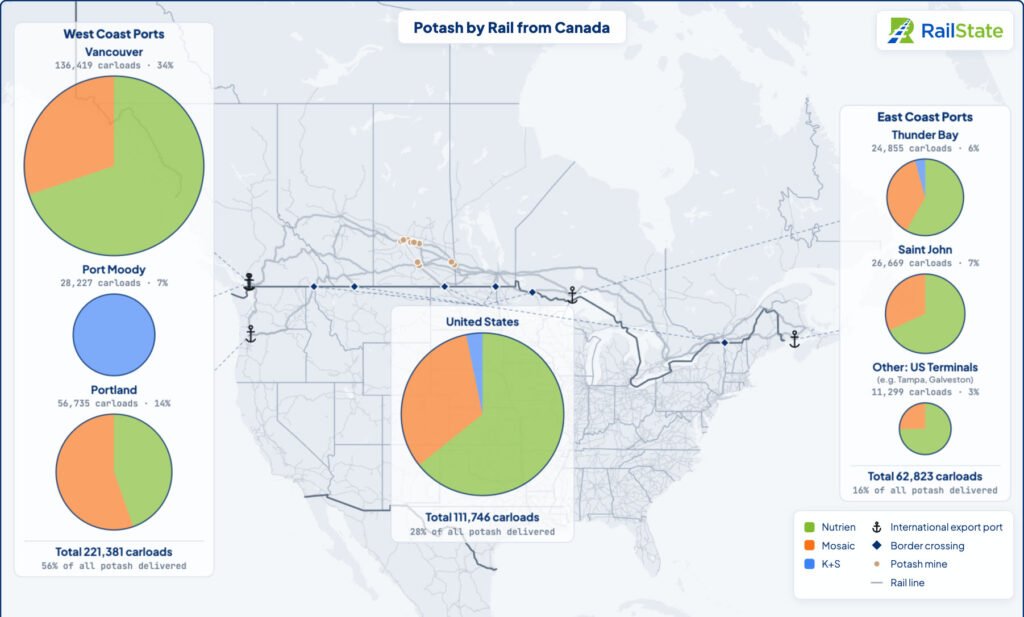
Between March 2025 and September 2026, 72% of the potash railed from the mines went to export terminals and 28% went to North American markets. The West Coast ports took 56% of everything delivered: Vancouver’s Neptune terminal alone received 34% of all carloads, Portland, Oregon, 14%, and K+S’s terminal at Port Moody, B.C., 7%. The East Coast ports took 16%: Saint John, New Brunswick, 7%, Thunder Bay 6%, and other US terminals such as Tampa and Galveston 3%. Of the North American traffic, about 80% was last read at a border crossing into the U.S. Midwest, the Corn Belt lane, with smaller flows continuing to Chicago, Florida, and the Gulf Coast. The mix varies by producer. Over the two years to August 2026, Nutrien sent 68% of its potash to export terminals, Mosaic 71%, and K+S 87%.
How It Moves
Saskatchewan’s potash leaves the province on two railroads, and the split between them depends on where the train is going. Over the period, CPKC originated 65% of potash cars and CN 35%, but CPKC handled 75% of the traffic bound for export terminals while CN handled 58% of the traffic bound for North American markets. The producers differ as well: Mosaic’s mines ship 80% of their potash on CPKC, Nutrien’s are split roughly evenly between the two, and K+S ships only on CPKC. In all, RailState identified 6,133 potash trains over the two years.
How RailState Compares With the Official Record
Government statistics and company reports describe these same flows, weeks or months later. None of them measures exactly what a trackside sensor measures, so each chart carries a note on the counting difference that accounts for its gap. All figures are as of September 17, 2026, and RailState volumes assume 100 tonnes per car.
RailState Compared to Railroad-Supplied Carloadings Data
Sources: RailState sensor network and Statistics Canada, railway carloadings statistics by commodity, monthly (table 23-10-0216-02).
RailState’s monthly count of potash cars matched Statistics Canada’s railway carloadings survey to within 1% over the 23 months both cover. The survey is compiled from carload counts the railways report to Statistics Canada, while RailState counts the cars itself as loaded trains leave the mines, so the two series arrive at the same total by different routes. Statistics Canada publishes the survey about eight weeks after each month ends; RailState’s count is available in real time.
US Potash Imports
This chart includes potash railed to Portland and other US ports, more than a third of the total, which is shipped on to overseas markets.
Sources: RailState sensor network and US International Trade Commission DataWeb, general imports, HTS 3104.20.
Against U.S. import records, RailState’s border-crossing volumes ran at 105% over two years. The import records are published about five weeks after each month ends; RailState’s counts are available in real time. The small difference reflects what each source counts: Customs records potash when it clears, by every mode of transport, while RailState counts rail cars as they cross the border at an assumed 100 tonnes each.
Canadian Potash International Exports (to Countries Other than the US)
This chart covers only Canadian ports. Potash shipped through Canpotex’s terminal in Portland and other US ports counts as an export to the US and appears in the US chart instead.
Sources: RailState sensor network and Statistics Canada, Canadian International Merchandise Trade Web Application, total exports, HS 3104.20.
Against Statistics Canada’s export records for destinations other than the U.S., RailState’s deliveries to export terminals ran at 109%, with the export records also published about five weeks after each month ends. This is the comparison with the clearest structural gap, and it is a matter of timing rather than measurement: RailState counts a tonne when the train reaches the terminal, Statistics Canada counts it when it sails, and the terminals hold inventory in between. RailState therefore runs ahead of the export record while terminal stocks are building and behind it when they draw down.
RailState Measurements Compared to Nutrien-Reported Offshore Sales
Rail deliveries in Canpotex cars to the export terminals, including US ports, against Nutrien’s reported offshore sales, quarter by quarter.
Sources: RailState sensor network and Nutrien quarterly earnings releases.
Against Nutrien’s reported quarterly offshore sales, RailState’s deliveries in Canpotex cars to export terminals ran at 101% over eight quarters. Nutrien reports about five weeks after each quarter ends. Here too the gap is one of timing: Nutrien books a sale when the product is sold, which can be before or after the train reaches the terminal, and quarterly totals absorb most of that difference.
The totals agree once the counting rules are lined up. The difference is when they are available.
What Is Different About This Data
RailState operates its own network of more than 370 trackside sensors across North America. Each sensor reads every car on every passing train, and RailState follows each car from one read to the next. The data is not reported by a railroad, not sampled from waybills, and not survey-based, and it is available about 30 minutes after a train passes. For potash, that means a count of loaded cars by mine, producer, railroad, and destination, current to yesterday, rather than a national total published two months after the fact. No other source measures commodity movements at that level of detail and that close to real time.
The talks with Belarus may or may not produce a deal. Either way, the potash that feeds North American agriculture will keep leaving Saskatchewan on trains, and any change in where those trains go, south to the Midwest or west to the ports, will show up in RailState’s data within days. Traders, investors, and the companies that produce, ship, and use potash can see it as it happens, and decide accordingly.
Sources
- Reuters via U.S. News, "Trump Says US Is Working on Deal to Purchase Potash From Belarus," Sept. 21, 2026
- The Globe and Mail, "U.S. in talks to buy potash from Belarus at lower cost than what Canada charges, Trump says," Sept. 21, 2026
- Natural Resources Canada, Potash facts and Mineral trade, 2025
- Library of Parliament, HillNotes, "Potash and the Canada–United States Trade Relationship," June 2025
- U.S. Geological Survey, Mineral Commodity Summaries 2026, Potash
- Statistics Canada, The Daily, Rail transportation, 2022. Table 23-10-0216-02, railway carloadings by commodity, monthly. Canadian International Merchandise Trade, HS 3104.20
- U.S. International Trade Commission DataWeb, general imports, HTS 3104.20
- Nutrien Ltd., quarterly earnings releases, 2024–2026
- Canpotex, Transportation logistics
- RailState sensor network observations, August 2024 – September 16, 2026
