A Tale of Two Corridors
Measured in days, not hours: what hundreds of thousands of container journeys show about how the Vancouver→Toronto and Los Angeles→Chicago rail corridors actually perform.
In recent statements about the supply chain, Prime Minister Mark Carney said Canada had “fallen way behind in terms of the productivity of our ports and our trade corridors,” with goods reaching central Canada in “weeks, not days.”
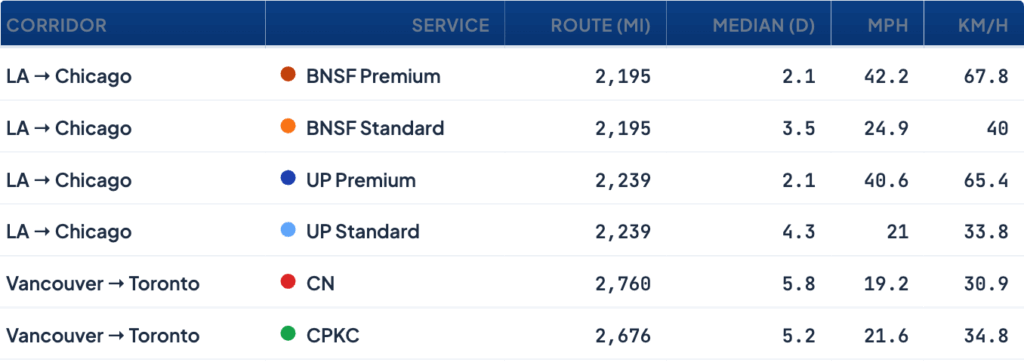
We wanted to know what the data really said. We chose two corridors that capture the same journey in each country — from the largest container port to the largest inland market it feeds: Vancouver to Toronto, and Los Angeles/Long Beach to Chicago. Each runs about two thousand miles and is served by two railroads. We then followed hundreds of thousands of individual containers across them. The numbers are straightforward. A container crossing Canada moves at roughly 19 to 22 miles per hour (30-34kph); the fastest service on the US lanes move at more than 40 mph (65kph). Over a two-thousand-mile journey, that difference shows up in days.
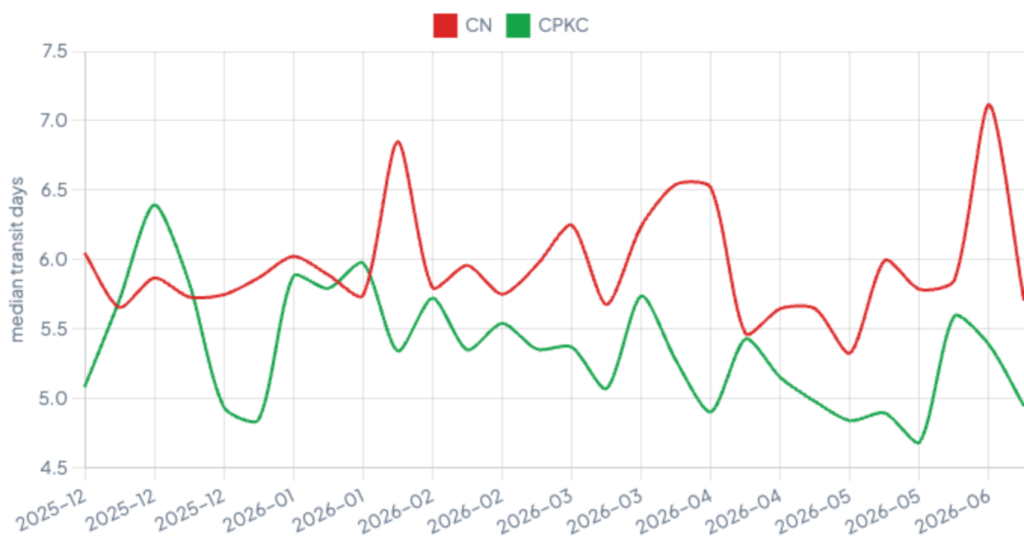
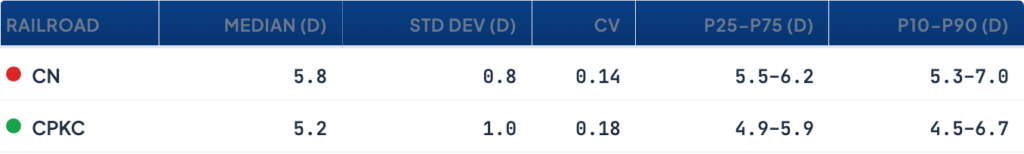
Canada: one speed, and only one
On the Canadian transcontinental lane, transit times cluster tightly. CN delivers Vancouver to Toronto in a median of 5.7 days; CPKC does it in 5.1. Each railroad runs a single intermodal product rather than separate premium and standard tiers, so the sample is concentrated in a narrow five-to-six-day range. Between the two, CPKC is about half a day quicker, while CN is the more consistent, with the tightest trip-to-trip spread of any railroad we measured.
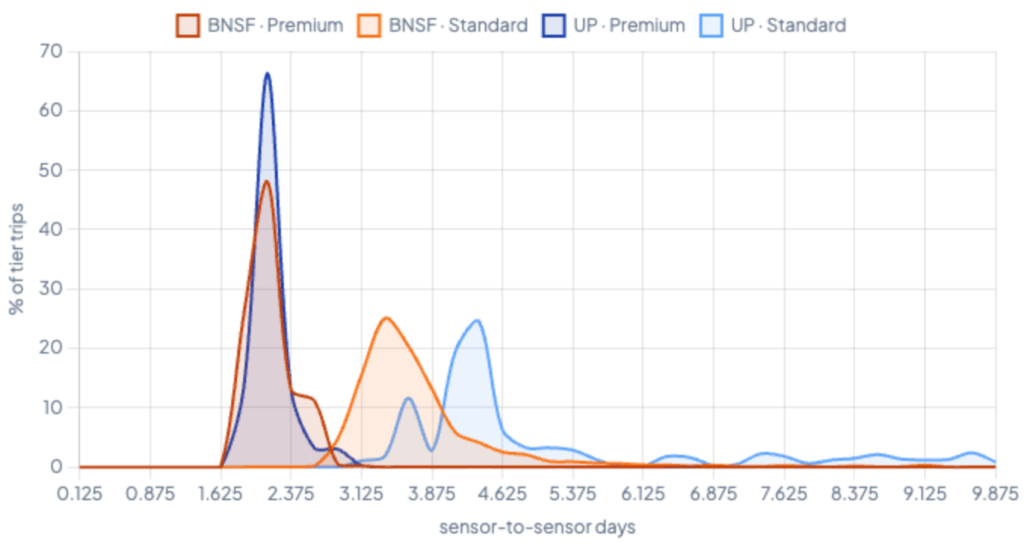
The United States: two speeds, and a tale of two standards
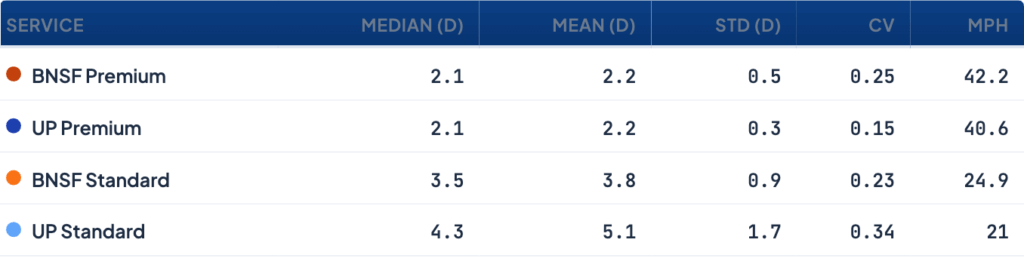
The American corridor could not be more different — here the data splits cleanly in two. Both BNSF and Union Pacific run a premium “Z-train” service that crosses the continent in a median of 2.1 days at 40-plus mph — parcel and team-driver-competitive freight — and on this tier the two railroads are nearly indistinguishable. UP’s premium product is, in fact, the single most consistent service on either side of the border.
But premium is the exception, not the rule, and it is on ordinary standard service — the bulk of the freight — that the two US railroads pull apart. BNSF’s standard intermodal runs Los Angeles/Long Beach to Chicago in a median 3.5 days at nearly 25 mph, and it does so predictably. UP’s standard service takes 4.3 days at 21 mph, with week-to-week variability nearly twice BNSF’s. On premium service the two railroads measure nearly the same. On standard service — which carries most of the freight — their medians sit about a day apart and their week-to-week consistency differs. That distinction appears in no published schedule. It emerges only from measuring actual performance.
Throughput is steady to rising
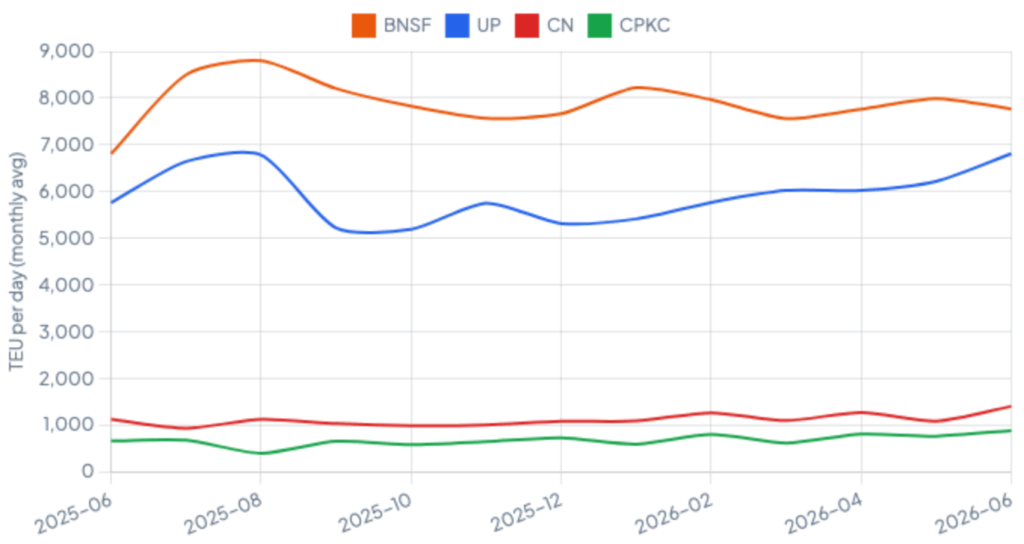
Volume rounds out the picture. Eastbound intermodal throughput has been steady to rising on all four routes since mid-2025. The most notable recent movement is on the US lane. UP’s volumes out of Southern California have been increasing in recent weeks, and we will have a new report out tomorrow with the story behind that change. BNSF remains the heaviest mover, and the Vancouver routes are trending up as well. The chart below tracks each route’s daily TEU at its gateway.
Why this matters
For a shipper, this is operational: which railroad to book, and what transit to promise a customer. For a logistics provider, it is competitive intelligence — the real, observed performance of every lane rather than a published schedule. And for policymakers weighing billions in trade-corridor investment, it is a measurement baseline: you cannot manage what you cannot measure, and an annual statistic published two years later cannot tell you whether a project is working.
What makes that possible is coverage. RailState observes the full network, so a corridor’s performance, and any change in it, becomes visible as it happens rather than inferred long after the fact. That complete, common view of the network is what turns a conversation about trade corridors into something a country can actually manage and measure, route by route and week by week.